 RSS Feed
 by Calculated Risk on 6/23/2011 07:57:00 PM
Thursday, June 23, 2011
Greece Update and European Bond and CDS Spreads
First from the WSJ: EU Stops Greek Backtracking
European Union leaders fended off an effort by Greece to water down an austerity and privatization package that is the price for new aid, and EU President Herman Van Rompuy said they were nearing approval on a new rescue program to take Athens until the end of 2014.More austerity ...
...
"We have a deal after the Greek government agreed to more spending cuts and some higher taxes," said the [Greek] official.
And here is a look at European bond spreads from the Atlanta Fed weekly Financial Highlights released yesterday (graph as of June 22nd).
From the Atlanta Fed:
Since the April FOMC meeting, the 10-year Greece-to-German bond spread has widened by nearly 400 basis points (bps) through June 22. The spreads for Ireland and Portugal have soared by 157 bps and 199 bps, respectively, over the same period.
 Click on graph for larger image in new window.
The spreads for Greece, Ireland and Portugal are all near record highs. The spreads for both Ireland and Portugal are about as high as Greece a couple of months ago!
Spreads for Spain and Italy have increased recently, but are still much lower than for Greece, Ireland and Portugal.
The second graph shows the Credit Default Swap (CDS) spreads:
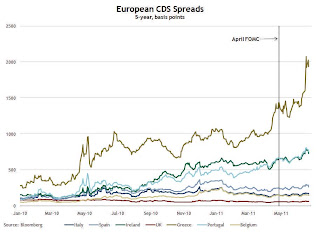 From the Atlanta Fed:
 The CDS spread on Greek debt has widened about 500 basis points (bps) since the April FOMC meeting, while those on Portuguese and Irish debt continue to be high.The Greek 2 year yield was up to 28.6% today. The ten year yield was up to 16.9%.
Misc: Release of Oil Reserves, Greek Agreement, another House Price index shows increase
by Calculated Risk on 6/23/2011 04:10:00 PM
• The big story of the day was the announcement of the release of oil from reserves. From the WSJ: U.S., IEA to Release Oil from Reserves
[T]he International Energy Agency said its members will release 60 million barrels of crude from emergency stocks, half from the U.S. strategic reserve, to offset production lost to the unrest in Libya, only the third time in its history that the IEA has intervened in this way.• From CNBC: Greece Agrees on Austerity Plan With EU, IMF: Report
Greece won the consent of a team of EU-IMF inspectors for its new five-year austerity plan after committing to an additional round of tax rises and spending cuts, both Reuters and Dow Jones reported Thursday.• And on house prices from Radar Logic:
The 25-MSA RPX Composite price increased two percent month over month ... Nevertheless, the change in the RPX Composite from January to April was negative for only the third time in the last ten yearsThe Radar Logic index is based on public records of all closed housing transactions nationally for the month of April, expressed as a price per square foot (not a repeat sales index). This is another index showing a bounce in April.
Radar Logic has a pretty good track record of predicting Case-Shiller house prices, so this prediction was especially interesting:
Last month, we predicted that the S&P/Case-Shiller 10-City composite for March 2011 would be about 152 and the 20-City composite would be roughly 138. In fact, the 10-City composite was 151.66 and the 20-City composite was 138.16.This is for the Not Seasonally Adjusted (NSA) Case-Shiller data - and usually April is seasonally a tough month for Case-Shiller (since it is an average of closed transactions in February, March and April). This would be the first increase in Case-Shiller NSA since last July, and the first increase seasonally adjusted (SA) since last June.
This month, we expect the April 2011 10-City composite index to be about 153 and the 20-City index to be roughly 140.
The Case-Shiller index will be released next Tuesday.
And on May Home Sales:
• New Home Sales in May at 319 Thousand SAAR
• May Existing Home Sales: 4.81 million SAAR, 9.3 months of supply
• Graph Galleries: New Home sales and Existing Home sales
Chicago Fed: Economic growth remained below average in May
by Calculated Risk on 6/23/2011 03:22:00 PM
No surprise (this is a composite index) ... from the Chicago Fed: Index shows economic growth remained below average in May
The index’s three-month moving average, CFNAI-MA3, declined to –0.19 in May from –0.15 in April, remaining negative for a second consecutive month and reaching its lowest level since November 2010. May’s CFNAI-MA3 suggests that growth in national economic activity was below its historical trend. With regard to inflation, the CFNAI-MA3 suggests subdued inflationary pressure from economic activity over the coming year.This graph shows the Chicago Fed National Activity Index (three month moving average) since 1967.
 Click on graph for larger image in graph gallery.
According to the Chicago Fed:
A zero value for the index indicates that the national economy is expanding at its historical trend rate of growth; negative values indicate below-average growth; and positive values indicate above-average growth.This index suggests the economy was still growing in May, but below trend.
Home Sales: Distressing Gap
by Calculated Risk on 6/23/2011 12:20:00 PM
The following graph shows existing home sales (left axis) and new home sales (right axis) through May. This graph starts in 1994, but the relationship has been fairly steady back to the '60s.
Then along came the housing bubble and bust, and the "distressing gap" appeared due mostly to distressed sales. The flood of distressed sales has kept existing home sales elevated, and depressed new home sales since builders can't compete with the low prices of all the foreclosed properties.
 Click on graph for larger image in graph gallery.
I expect this gap to close over the next few years once the number of distressed sales starts to decline.
Note: Existing home sales are counted when transactions are closed, and new home sales are counted when contracts are signed. So the timing of sales is different. Also the National Association of Realtors (NAR) is working on a benchmark revision for existing home sales numbers and I expect significant downward revisions to sales estimates for the last few years - perhaps as much as 10% to 15% for 2009 and 2010. Even with these revisions, most of the "distressing gap" will remain.
Earlier on May Home Sales:
• New Home Sales in May at 319 Thousand SAAR
• May Existing Home Sales: 4.81 million SAAR, 9.3 months of supply
• Graph Galleries: New Home sales and Existing Home sales
New Home Sales in May at 319 Thousand SAAR
by Calculated Risk on 6/23/2011 10:00:00 AM
The Census Bureau reports New Home Sales in May were at a seasonally adjusted annual rate (SAAR) of 319 thousand. This was down from a revised 326 thousand in April (revised from 323 thousand).
The first graph shows New Home Sales vs. recessions since 1963. The dashed line is the current sales rate.
Sales of new one-family houses in May 2011 were at a seasonally adjusted annual rate of 319,000 ... This is 2.1 percent (±10.7%)* below the revised April rate of 326,000, but is 13.5 percent (±13.6%)* above the May 2010 estimate of 281,000.
 Click on graph for larger image in graph gallery.
And a long term graph for New Home Months of Supply.
Months of supply decreased to 6.2 in May from 6.3 months in April. The all time record was 12.1 months of supply in January 2009. This is still higher than normal (less than 6 months supply is normal).

The seasonally adjusted estimate of new houses for sale at the end of May was 166,000. This represents a supply of 6.2 months at the current sales rate.On inventory, according to the Census Bureau:
"A house is considered for sale when a permit to build has been issued in permit-issuing places or work has begun on the footings or foundation in nonpermit areas and a sales contract has not been signed nor a deposit accepted."
 Starting in 1973 the Census Bureau broke this down into three categories: Not Started, Under Construction, and Completed.
This graph shows the three categories of inventory starting in 1973.
The inventory of completed homes for sale fell to 64,000 units in May. The combined total of completed and under construction is at the lowest level since this series started.
 The last graph shows sales NSA (monthly sales, not seasonally adjusted annual rate).
In May 2011 (red column), 30 thousand new homes were sold (NSA). The record low for May was 26 thousand in 2010 (following the expiration of the homebuyer tax credit) and now 2011. The high was 120 thousand in 2005.
Although above the consensus forecast of 305 thousand, this was just above the record low for May - and new home sales have averaged only 300 thousand SAAR since the expiration of the tax credit ... moving sideways at a very low level.


