 RSS Feed
 by Calculated Risk on 10/29/2010 01:06:00 PM
Friday, October 29, 2010
Real GDP: Still 0.8% below pre-recession levels
Real GDP is 0.8% below the pre-recession peak, so real GDP would have to grow at a 3.1% annualized pace in Q4 for the economy to be back at the pre-recession peak.
That is unlikely since growth in personal consumption expenditures (PCE) will probably slow in Q4, and the contribution from the change in private inventories will likely be much smaller or negative in Q4.
Probably the earliest the economy will be back to pre-recession levels for GDP would be in Q1 2011 and that requires a 1.6% annualized growth rate over the next two quarters. It might even take until Q2 2011 (my current forecast).
Note: The following graphs are all constructed as a percent of the peak in each indicator. This shows when the indicator has bottomed - and when the indicator has returned to the level of the previous peak. If the indicator is at a new peak, the value is 100%.
 Click on graph for larger image in new window.
This graph is for real GDP through Q3 2010.
Real GDP is still 0.8% below the pre-recession peak.
Based on the June FOMC forecasts, real GDP would be close or above the pre-recession peak by now. So clearly those forecasts will be revised down next week.
And GDP has performed better than other indictors.
 The second graph is for real personal income less transfer payments (also released today for Q3 as part of the GDP report).
Real personal income less transfer payments is still 5.5% below the pre-recession peak. Much of the growth in PCE over the last year has come from transfer payments - this includes people taking Social Security early, extended unemployment benefits, and other assistance programs - and it will be some time before this indicator returns to pre-recession levels.
And two more graphs to show two key monthly indicators:
 This graph is for industrial production through Septmember.
Industrial production has been one of the stronger performing sectors because of inventory restocking and some growth in exports. However industrial production is still 7.5% below the pre-recession peak, and it appears export growth has slowed, and the inventory cycle is almost over.
One of the surprises in the GDP report today was the strong contribution from changes in private inventories. That will probably slow over the next few quarters - and may even turn negative. So it will probably be some time before industrial production returns to pre-recession levels.
 The final graph is for employment. This is similar to the graph I post every month comparing percent payroll jobs lost in several recessions.
Payroll employment is still 5.6% below the pre-recession peak. And with below trend GDP growth, payroll employment growth will likely remain sluggish.
Chicago PMI increases, Consumer Sentiment weak
by Calculated Risk on 10/29/2010 09:55:00 AM
Two stories ...
From the Institute for Supply Management – Chicago: The overall index increased to 60.6 vs 60.4. Note: any number above 50 shows expansion. Employment index increased to 54.6 from 53.4 in September. The new orders index increased to 65.0 from 61.4.
Overall this was a positive report. The national ISM manufacturing index will be released on Monday.
From MarketWatch: Consumer sentiment falls in October to 67.7
 Click on graph for larger image in new window.
This was a big story in July when consumer sentiment collapsed. Sentiment in October was slightly below the level in July - and this is the lowest level since late 2009.
Consumer sentiment is a coincident indicator and reflects the weak economy.
Q3 Advance Report: Real Annualized GDP Grew at 2.0%
by Calculated Risk on 10/29/2010 08:30:00 AM
Real gross domestic product -- the output of goods and services produced by labor and property located in the United States -- increased at an annual rate of 2.0 percent in the third quarter of 2010, (that is, from the second quarter to the third quarter), according to the "advance" estimate released by the Bureau of Economic Analysis.
 Click on graph for larger image in new window.
This graph shows the quarterly GDP growth (at an annual rate) for the last 30 years. The dashed line is the median growth rate of 3.05%. The current recovery is very weak - the 2nd half slowdown continues.
A few key numbers:
Without the boost in inventories, GDP would have been barely positive in Q3.
This was a little stronger than expected, and PCE will probably slow over the next couple of quarters.
As expected, residential investment declined sharply after the Q2 tax credit boost.
Overall this was a weak report and will not derail QE2 next wednesday (further easing from the Fed).
Thursday, October 28, 2010
Foreclosure-Gate: Title Insurers Drop Demands
by Calculated Risk on 10/28/2010 09:49:00 PM
From Elizabeth Razzi at the WaPo: Title insurers drop demands on mortgage lenders in foreclosure cases
Three major title insurance companies - First American Financial, Old Republic International and Stewart Information Services - told Wall Street analysts in conference calls Thursday that they had decided not to demand written indemnifications from lenders re-selling foreclosed homes. Combined, the three companies account for 52 percent of the title insurance market.This is means that the buyers of REO (lender Real Estate Owned) will be able to obtain title insurance, and that the new owner can sell the property. There was some concern that buyers would shy away from REOs.
House Prices have corrected to what year?
by Calculated Risk on 10/28/2010 05:45:00 PM
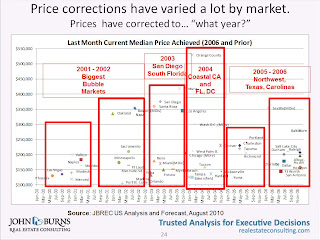
Housing consultant John Burns presented this slide as part of the UCLA Anderson Forecast this week:
 Click on graph for larger image in new window.
John Burns used median prices for this slide. It shows that the "biggest bubble markets" are back to 2000 to 2002 median prices, whereas some areas are still at 2006 prices.
And here is a timeline for the 20 Case-Shiller cities:
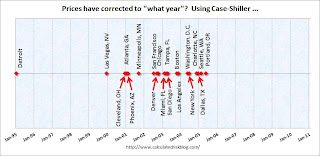 There is no y-axis because this is based on a price index (not median prices).
Detroit is back to 1995 prices, and some cities like Dallas, Portland and Seattle are only back to 2005 or 2006 prices (the bubble arrived later in the Northwest).


