 RSS Feed
 by Calculated Risk on 10/21/2010 10:38:00 PM
Thursday, October 21, 2010
Shanghai Composite Update
Just an update ... it seems like the Shanghai and the S&P 500 (and oil prices too - not shown) are all moving together.

This graph shows the Shanghai SSE Composite Index and the S&P 500 (in blue).
The SSE Composite index is at 2,963.50, up about 14% since late August. The S&P 500 and oil are both up about 10% over the same period.
FOMC and QE2
by Calculated Risk on 10/21/2010 06:17:00 PM
A few people have asked me for a summary of the views of current FOMC members concerning QE2. Although no one has committed, here is my best guess based on recent speeches or other information ... there appears to be a majority of FOMC member who will vote "Yes", not counting the three labeled as "probably".
| Person, Position | FOMC Membership | QE2 Position |
|---|---|---|
| Ben S. Bernanke, Board of Governors, Chairman | FOMC | Yes |
| Janet L. Yellen, Fed Vice Chairman, Board of Governors | FOMC | Yes |
| William C. Dudley, New York, FOMC Vice Chairman | FOMC | Yes |
| James Bullard, St. Louis | FOMC | Yes |
| Elizabeth A. Duke, Board of Governors | FOMC | Yes (probably) |
| Thomas M. Hoenig, Kansas City | FOMC | No |
| Sandra Pianalto, Cleveland | FOMC | Yes |
| Sarah Bloom Raskin, Board of Governors | FOMC | Yes (probably) |
| Eric S. Rosengren, Boston | FOMC | Yes |
| Daniel K. Tarullo, Board of Governors | FOMC | Yes (probably) |
| Kevin M. Warsh, Board of Governors | FOMC | Undecided |
| Charles L. Evans, Chicago | Alternate | Yes |
| Richard W. Fisher, Dallas | Alternate | Undecided |
| Narayana Kocherlakota, Minneapolis | Alternate | Undecided |
| Charles I. Plosser, Philadelphia | Alternate | No |
| Christine M. Cumming, First Vice President, New York | Alternate | Unknown |
Hotel Performance: RevPAR up 9.4% compared to same week in 2009
by Calculated Risk on 10/21/2010 02:17:00 PM
Hotel occupancy is one of several industry specific indicators I follow ...
Important: Even though the occupancy rate is close to 2008 levels, 2010 is a much more difficult year for the hotel industry than 2008. RevPAR (revenue per available room) is up 9.4% compared to 2009, but still down 7.8% compared to 2008 - and 2008 was a very difficult year for the hotel industry.
From HotelNewsNow.com: STR: Economy ADR performance falls short
Overall occupancy increased 8.3% to 63.8%, ADR was up 0.9% to US$100.40, and RevPAR ended the week up 9.4% to US$64.09.The following graph shows the four week moving average for the occupancy rate by week for 2008, 2009 and 2010 (and a median for 2000 through 2007).
 Click on graph for larger image in new window.
Notes: the scale doesn't start at zero to better show the change. The graph shows the 4-week average, not the weekly occupancy rate.
On a 4-week basis, occupancy is up 7.9% compared to last year (the worst year since the Great Depression) and 6.1% below the median for 2000 through 2007.
The occupancy rate is about at the levels of 2008, but RevPAR is still down 7.8%.
Data Source: Smith Travel Research, Courtesy of HotelNewsNow.com
FHFA Projections for Fannie and Freddie draws, and House Price Assumptions
by Calculated Risk on 10/21/2010 11:35:00 AM
From the FHFA: FHFA Releases Projections Showing Range of Potential Draws for Fannie Mae and Freddie Mac
To date, the Enterprises have drawn $148 billion from the Treasury Department under the terms of the [Preferred Stock Purchase Agreements] PSPAs. Under the three scenarios used in the projections, cumulative Enterprise draws range from $221 billion to $363 billion through 2013.The key to the size of future draws is the trajectory of house prices. The following graph shows the three house projections used by the FHFA:
 Click on graph for larger image in new window.
From the FHFA:
Stronger Near-term Recovery (FHFA Scenario 1) “Increased access to credit supports the above baseline growth. As a result, the recent increases in house prices are sustained, although additional increases are minimal in 2010 and 2011.” The peak to-trough decline is 31%. From the trough in 1Q09 to the end of the forecast period house prices increase by 5%.My current projection is for further house price declines of 5% to 10%, as measured by the Case-Shiller and Corelogic repeat sales indexes. That would put the peak-to-trough decline around 36% or so. So my guess is somewhere between scenarios 2 & 3.
Current Baseline (FHFA Scenario 2) "Small remaining home price declines" contribute to a 34% peak-to-trough decline. From the trough in 3Q11 to the end of the forecast period house prices increase by 8%.
Deeper Second Recession (FHFA Scenario 3) “As a result of restricted access to credit and continuing high unemployment, the moderate
rebound in housing construction that occurred over the first half of 2009 not only pauses but reverses course." The peak-to-trough decline is 45%. From the trough in 1Q12 to the end of the forecast period house prices increase by 11%.
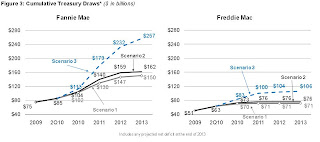 And this graph shows the projected draws for each of the above scenarios.
My guess is the draw will be somewhat over scenario 2, but well below the FHFA's scenario 3.
Philly Fed Index "steady" in October
by Calculated Risk on 10/21/2010 10:00:00 AM
Here is the Philadelphia Fed Index: Business Outlook Survey
Results from the Business Outlook Survey suggest that regional manufacturing activity was steady in October. Although the broad survey measures showed marginal improvement this month, the new orders index continued to suggest weak demand for manufactured goods.
...
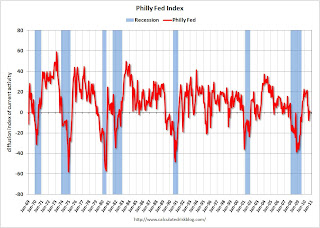
The survey’s broadest measure of manufacturing conditions, the diffusion index of current activity, increased from a reading of –0.7 in September to 1.0 in October. The index had been negative for two consecutive months (see Chart). Indexes for new orders and shipments continued to indicate weakness this month: The new orders index increased 3 points but remained negative for the fourth consecutive month.
...
Firms reported near steady employment again this month, but lower average work hours for existing employees. The percentage of firms reporting increases in employment (20 percent) narrowly edged out the percentage of firms reporting decreases (17 percent). The index for employment was slightly positive for the second consecutive month but increased just 1 point. Indicative of still weak activity, more firms reported declines in average work hours for existing employees (22 percent) than reported increases (16 percent).emphasis added
 Click on graph for larger image in new window.
This graph shows the Philly index for the last 40 years.
This index turned down sharply in June and July and was negative in August and September (indicating contraction). The index was barely positive in October, and the internals (new orders, employment) are still weak.
These surveys are timely, but noisy. However this is further evidence of a slowdown in manufacturing. This was slightly worse than the consensus view of a reading of 1.8 (slight expansion).


