 RSS Feed
 by Calculated Risk on 9/21/2010 02:15:00 PM
Tuesday, September 21, 2010
FOMC Statement: "Prepared to provide additional accommodation "
Paving the way for QE2 ...
From the Fed:
Information received since the Federal Open Market Committee met in August indicates that the pace of recovery in output and employment has slowed in recent months. Household spending is increasing gradually, but remains constrained by high unemployment, modest income growth, lower housing wealth, and tight credit. Business spending on equipment and software is rising, though less rapidly than earlier in the year, while investment in nonresidential structures continues to be weak. Employers remain reluctant to add to payrolls. Housing starts are at a depressed level. Bank lending has continued to contract, but at a reduced rate in recent months. The Committee anticipates a gradual return to higher levels of resource utilization in a context of price stability, although the pace of economic recovery is likely to be modest in the near term.
Measures of underlying inflation are currently at levels somewhat below those the Committee judges most consistent, over the longer run, with its mandate to promote maximum employment and price stability. With substantial resource slack continuing to restrain cost pressures and longer-term inflation expectations stable, inflation is likely to remain subdued for some time before rising to levels the Committee considers consistent with its mandate.
The Committee will maintain the target range for the federal funds rate at 0 to 1/4 percent and continues to anticipate that economic conditions, including low rates of resource utilization, subdued inflation trends, and stable inflation expectations, are likely to warrant exceptionally low levels for the federal funds rate for an extended period. The Committee also will maintain its existing policy of reinvesting principal payments from its securities holdings.
The Committee will continue to monitor the economic outlook and financial developments and is prepared to provide additional accommodation if needed to support the economic recovery and to return inflation, over time, to levels consistent with its mandate.
Voting for the FOMC monetary policy action were: Ben S. Bernanke, Chairman; William C. Dudley, Vice Chairman; James Bullard; Elizabeth A. Duke; Sandra Pianalto; Eric S. Rosengren; Daniel K. Tarullo; and Kevin M. Warsh.
Voting against the policy was Thomas M. Hoenig, who judged that the economy continues to recover at a moderate pace. Accordingly, he believed that continuing to express the expectation of exceptionally low levels of the federal funds rate for an extended period was no longer warranted and will lead to future imbalances that undermine stable long-run growth. In addition, given economic and financial conditions, Mr. Hoenig did not believe that continuing to reinvest principal payments from its securities holdings was required to support the Committee’s policy objectives.
FOMC Preview
by Calculated Risk on 9/21/2010 12:25:00 PM
In general I think little will change in the FOMC statement this month.
Update: The FOMC (and staff) will present their updated forecasts in November, but the forecasts will not be available until the minutes are released. Since the previous forecasts were too optimistic (see table below1), it is very likely their new forecasts will be are lower - but it is unclear if this will be mentioned in the statement today.
In a research note yesterday, Goldman Sachs suggested the following four possibilities (from "dovish" to "hawkish"):
1. No substantive change in the policy statement.Goldman's view is the focus would be on #2 and #3. I think #4 is off the table for now, and #1 is still a possibility.
2. Recognition of a weaker economic outlook, but without an explicit signal that renewed unconventional easing is under consideration.
3. An explicit signal that renewed easing is under consideration.
4. An announcement of renewed easing.
1Here are the forecasts from the June 22-23, 2010 (and May 9th) FOMC meeting. The Fed revised down their forecasts in June, but they were still too optimistic:
| Economic projections of Federal Reserve Governors and Reserve Bank presidents | |||
|---|---|---|---|
| 2010 | 2011 | 2012 | |
| Change in Real GDP | 3.0% to 3.5% | 3.5% to 4.2% | 3.5% to 4.5% |
| April projection | 3.2% to 3.7% | 3.4% to 4.5% | 3.5% to 4.5% |
| Unemployment Rate | 9.2% to 9.5% | 8.3% to 8.7% | 7.1% to 7.5% |
| April projection | 9.1% to 9.5% | 8.1% to 8.5% | 6.6% to 7.5% |
| PCE Inflation | 1.0% to 1.1% | 1.1% to 1.6% | 1.0% to 1.7% |
| April projection | 1.2% to 1.5% | 1.1% to 1.9% | 1.2% to 2.0% |
State Unemployment Rates in August: "Little changed" from July
by Calculated Risk on 9/21/2010 10:00:00 AM
 Click on graph for larger image in new window.
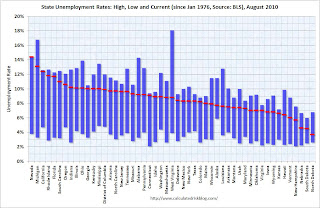
This graph shows the high and low unemployment rates for each state (and D.C.) since 1976. The red bar is the current unemployment rate (sorted by the current unemployment rate).
Thirteen states now have double digit unemployment rates (up from eleven last month). A number of other states are close.
Nevada set a new series high at 14.4% and now has the highest state unemployment rate. Michigan held the top spot for over 4 years until May.
From the BLS: Regional and State Employment and Unemployment Summary
Regional and state unemployment rates were little changed in August. Twenty-seven states recorded unemployment rate increases, 13 states registered rate decreases, and 10 states and the District of Columbia had no rate change, the U.S. Bureau of Labor Statistics reported today.
...
Nevada again reported the highest unemployment rate among the states, 14.4 percent in August, which was a new series high for the state. (All region, division, and state series begin in 1976.) The states with the next highest rates were Michigan, 13.1 percent, and California, 12.4 percent. North Dakota continued to register the lowest jobless rate, 3.7 percent, followed by South Dakota and Nebraska, at 4.5 and 4.6 percent, respectively.
emphasis added
Single Family Housing Starts increase slightly in August
by Calculated Risk on 9/21/2010 08:30:00 AM
 Click on graph for larger image in new window.
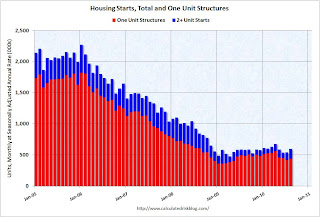
Total housing starts were at 598 thousand (SAAR) in August, up 10.5% from the revised July rate of 541 thousand (revised down from 546 thousand), and up 25% from the all time record low in April 2009 of 477 thousand (the lowest level since the Census Bureau began tracking housing starts in 1959).
Single-family starts increased 4.3% to 438 thousand in August. This is 22% above the record low in January 2009 (360 thousand). 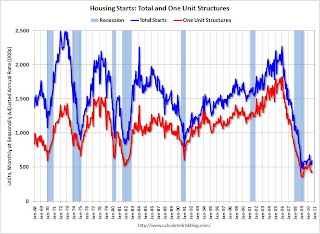 The second graph shows total and single unit starts since 1968. This shows the huge collapse following the housing bubble, and that housing starts have mostly been moving sideways for over a year - with a slight up and down over the last several months due to the home buyer tax credit.
Here is the Census Bureau report on housing Permits, Starts and Completions.
Housing Starts:This was above expectations of 550 thousand, mostly because of the volatile multi-family starts. As I've mentioned many times - this low level of starts is good news for the housing market longer term (there are too many housing units already), but bad news for the economy and employment short term.
Privately-owned housing starts in August were at a seasonally adjusted annual rate of 598,000. This is 10.5 percent (±11.9%)* above the revised July estimate of 541,000 and is 2.2 percent (±9.7%)* above the August 2009 rate of 585,000.
Single-family housing starts in August were at a rate of 438,000; this is 4.3 percent (±12.4%)* above the revised July figure of 420,000.
Building Permits:
Privately-owned housing units authorized by building permits in August were at a seasonally adjusted annual rate of 569,000. This is 1.8 percent (±2.0%)* above the revised July rate of 559,000, but is 6.7 percent (±1.4%) below the August 2009 estimate of 610,000.
Single-family authorizations in August were at a rate of 401,000; this is 1.2 percent (±1.0%) below the revised July figure of 406,000.
Monday, September 20, 2010
Flash Crash Report due in the next two weeks
by Calculated Risk on 9/20/2010 09:40:00 PM
From Graham Bowley at the NY Times: Ex-Physicist Leads Inquiry into Flash Crash
[The] long-awaited report on the so-called flash crash, in partnership with the Commodity Futures Trading Commission, is due to be published in the next two weeks.Hopefully the explanation will be clear and understandable.
...
[The SEC's Gregg Berman says] the report will zero in on a specific sequence of events that preceded the crash. He says it will tell a clear story about what happened in the markets on that stomach-churning day, beyond simply pointing a finger at the perils of the kind of high-speed computer trading that dominates today’s markets.
“The report will clearly demonstrate how market conditions and events prior to the flash crash led to the extreme price moves,” he said.
...
“Many market participants told us, ‘We’re not quite sure what happened over all, but this is what my firm saw and the actions we took,’ ” Mr. Berman said. “It was like ‘C.S.I.’ We wanted to interview everyone around.”


