 RSS Feed
 by Calculated Risk on 9/14/2010 08:30:00 AM
Tuesday, September 14, 2010
Retail Sales increase in August
On a monthly basis, retail sales increased 0.4% from July to August (seasonally adjusted, after revisions), and sales were up 3.6% from August 2009. Retail sales increased 0.6% ex-autos. 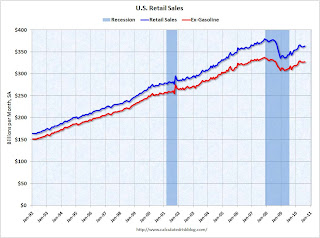 Click on graph for larger image in new window.
This graph shows retail sales since 1992. This is monthly retail sales, seasonally adjusted (total and ex-gasoline).
Retail sales are up 8.4% from the bottom, but still off 4.3% from the pre-recession peak.
Retail sales are still below the April level - and have mostly moved sideways for six months. The second graph shows the year-over-year change in retail sales (ex-gasoline) since 1993.
Retail sales ex-gasoline increased by 3.0% on a YoY basis (3.6% for all retail sales). The year-over-year comparisons were easier earlier this year since retail sales collapsed in late 2008.
Here is the Census Bureau report:
The U.S. Census Bureau announced today that advance estimates of U.S. retail and food services sales for August, adjusted for seasonal variation and holiday and trading-day differences, but not for price changes, were $363.7 billion, an increase of 0.4 percent (±0.5%)* from the previous month, and 3.6 percent (±0.5%) above August 2009. Total sales for the June through August 2010 period were up 4.7 percent (±0.3%) from the same period a year ago. The June to July 2010 percent change was revised from +0.4 percent (±0.5%)* to +0.3 percent (±0.2%).
TARP Deadbeat list grows to more than 120 banks
by Calculated Risk on 9/14/2010 12:01:00 AM
From Brady Dennis at the WaPo: More banks missing TARP dividend payments
The latest report ... shows that more than 120 institutions ... have missed their scheduled quarterly dividend payments ... a record six banks each missed six dividend payments. Saigon National Bank in Southern California has missed seven.
...
In addition, five banks that received capital injections from the controversial $700 billion Troubled Assets Relief Program have failed altogether, making it highly unlikely that taxpayers will recover the nearly $3 billion poured into those institutions.
Monday, September 13, 2010
Capital One CEO: "Very cautious about the housing market"
by Calculated Risk on 9/13/2010 07:15:00 PM
From William Alden at HuffPo: Home Prices Set To Fall Further: Richard Fairbank, Capital One CEO
"I think we feel very cautious about the housing market," [Capital One CEO Richard Fairbank] said. "I think that even despite some of the recent months where home prices have gone up, I think it's a very plausible case for home prices to go back down again."I think house prices started falling again in July, but it might take some time before we see prices falling in the repeat sales index. CoreLogic will probably release their July HPI this week, and that might show declining prices - but that is a weighted average of May, June and July.
...
"We are managing to a view that home prices are more likely to be headed down rather than up."
Investment Contributions to GDP: Leading and Lagging Sectors
by Calculated Risk on 9/13/2010 03:14:00 PM
By request, the following graph is an update to: The Investment Slump in Q2 2009
The following graph shows the rolling 4 quarter contribution to GDP from residential investment, equipment and software, and nonresidential structures. This is important to follow because residential investment tends to lead the economy, equipment and software is generally coincident, and nonresidential structure investment trails the economy.
For the following graph, red is residential, green is equipment and software, and blue is investment in non-residential structures. The usual pattern - both into and out of recessions is - red, green, blue. Click on graph for larger image in new window.
Residential Investment (RI) made a positive contribution to GDP in the Q2 2010, but RI will be a drag on GDP again in Q3.
RI was positively impacted in Q2 by the housing tax credit in two ways: first, builders rushed to complete homes by the end of June, and, second, real estate agent commissions were boosted in Q2 and will decline sharply in Q3 (just look at existing home sales in July).
The rolling four quarter change for RI just turned positive, but will turn negative again in Q3.
Equipment and software investment has made a significant positive contribution to GDP for four straight quarters (it is coincident).
The contribution from nonresidential investment in structures was flat in Q2 - only because of a surge of investment for petroleum and natural gas - while investment in hotels, malls and office buildings continued to decline. As usual nonresidential investment in structures is the last sector to recover.
The key leading sector - residential investment - has lagged the recovery because of the huge overhang of existing inventory. Usually RI is a strong contributor to GDP growth and employment in the early stages of a recovery, but not this time - and this is a key reason why the recovery has been sluggish so far.
On Retail Seasonal Hiring
by Calculated Risk on 9/13/2010 01:04:00 PM
October is the first month for seasonal retail hiring - and most hiring happens in November. So it is probably time to start looking ahead.
According to a survey released last week, most retailers plan on hiring about the same number of seasonal workers as last year (a weak year), however about one-fifth expect to hire more.
Here was an article from the WSJ: Holiday Job Outlook Stays Flat
Most major American retailers plan to hire the same number of temporary holiday workers as last year, according to a survey by a top industry consultant, underscoring that store chains continue to view the coming season with caution.
Still, the annual Hay Group survey ... found that more than one-fifth of respondents expected to hire more seasonal help than in 2009 ...
 Click on graph for larger image.
The first graph shows that seasonally adjusted (blue) and not seasonally adjusted (red) retail employment. There is a clear seasonal pattern (no surprise).
Not only is overall retail employment down, but seasonal hiring was very low in 2008, and still weak in 2009.
 The second graph shows the seasonal hiring by the three key months (October, November and December).
 Although seasonal hiring bounced back last year, it was still the second weakest year since 1989 (only 2008 was worse). From this early survey, it sounds like there should be some increase in seasonal hiring - but it will still be a very weak year.


