
 RSS Feed
 by Calculated Risk on 9/04/2010 05:41:00 PM
Saturday, September 04, 2010
Unemployment Rate and Level of Education
Another graph by request ... Click on graph for larger image in new window.
This graph shows the unemployment rate by four levels of education (all groups are 25 years and older).
Note that the unemployment rate increased sharply for all four categories in 2008 and into 2009.
Unfortunately this data only goes back to 1992 and only includes one previous recession (the stock / tech bust in 2001). Clearly education matters with regards to the unemployment rate - but education didn't seem to matter as far as the recovery rate in unemployment following the 2001 recession. All four groups recovered slowly.
So far this year, the group with "less than a high school diploma" has recovered a little better than the more educated groups - although the unemployment rate increased for all four groups in August. And here is a graphic from the BLS based on 2009 data: Education pays ...
This shows the unemployment rate and the the median weekly earnings by eight levels level of education.
The higher the education, the lower the unemployment rate - and the higher that median weekly earnings. Of course that doesn't necessarily mean that "education pays", because there is also a cost (both the actual cost and the opportunity cost), but in general education probably does pay (besides it is fun to learn).
And for Saturday readers, here are the employment posts yesterday (with many graphs):
Update: Total people receiving unemployment benefits
by Calculated Risk on 9/04/2010 01:21:00 PM
Here is a graph from the Atlanta Fed of the number of people receiving extended unemployment benefits ... Note: data as of Aug 7th - there were about 300,000 less people receiving benefits on Aug 14th (most recent data NSA). Click on graph for larger image.
From the Atlanta Fed:
The number of persons receiving extended benefits has shot up in the weeks following the reinstatement of the emergency unemployment compensation (EUC) program.That is an increase of almost 2 million people receiving aid since the program was reinstated.
Note: As people exhaust their regular benefits, they move on to receive extended benefits first through the federal EUC program and then their state’s extended benefits (EB) program.
• The number of persons receiving emergency unemployment compensation (EUC) has increased by nearly 1.6 million in the three weeks since the program was reinstated on July 22, 2010. For the week ending August 7, the number of claimants reached 4.9 million.
• Extended benefits (EB) claimants increased by more than 300,000 (or 50%) during the same period. There were 937,000 people claiming extended benefits for the week ending August 7.
• Currently, up to 73 weeks of benefits extensions are available including both the EUC and EB programs (53 weeks of EUC and 20 weeks of EB).
There are another 4.1 million people receiving regular unemployment benefits (NSA). So the total is close to 10 million (NSA).
Duration of Unemployment
by Calculated Risk on 9/04/2010 08:56:00 AM
An update by request ... Click on graph for larger image.
This graph shows the duration of unemployment as a percent of the civilian labor force. The graph shows the number of unemployed in four categories: less than 5 week, 6 to 14 weeks, 15 to 26 weeks, and 27 weeks or more.
Note: The BLS reports 15+ weeks, so the 15 to 26 weeks number was calculated.
In August 2010, the number of unemployed for 27 weeks or more declined significantly to 6.249 million (seasonally adjusted) from 6.752 million in July. It appears the number of long term unemployed has peaked, but it is still very difficult for these people to find a job - and this is a very serious employment issue.
The 5 to 14 week category increased sharply in August and is now at the highest level since October 2009 - and that is concerning.
Note: Even though these numbers are all seasonally adjusted, they can't be added together to calculate the unemployment rate. And a repeat of a popular graph ...
The second graph shows the job losses from the start of the employment recession, in percentage terms (as opposed to the number of jobs lost).
Best to all
Employment posts yesterday (with many graphs):
Friday, September 03, 2010
Unofficial Problem Bank List increases to 844 institutions
by Calculated Risk on 9/03/2010 10:56:00 PM
Note: this is an unofficial list of Problem Banks compiled only from public sources.
Here is the unofficial problem bank list for September 3, 2010.
Changes and comments from surferdude808:
It was a comparatively quiet week for the Unofficial Problem Bank List as there were only four additions and no removals with the FDIC taking the long holiday weekend off from closures.
The additions include First National Bank of Chester County, Chester, PA ($1.2 billion Ticker: FCEC); Lafayette Savings Bank, FSB, Lafayette, IN ($379 million Ticker: LSBI); Oregon Community Bank & Trust, Oregon, WI ($195 million); and Hull Federal Savings Bank, Baltimore, MD ($27 million). Other changes include Prompt Corrective Action Orders issued by the Federal Reserve against First Community Bank ($2.6 billion Ticker: FSNM) and Sunrise Bank ($134 million) and OTS against AnchorBank, fsb ($4.0 billion Ticker: ABCW).
The Unofficial Problem Bank List includes 844 institutions with aggregate assets of $412 billion. This week the FDIC released its official count of problem institutions at 829 with assets of $403 billion as of June 30th.
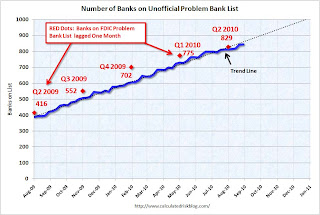 Click on graph for larger image in new window.
This graph shows the number of banks on the unofficial list. The number of institutions has more than doubled since we started the list in early August 2009 - even with all the bank failures (failures are removed from the list). The number of assets is up 50 percent over the last year.
On August 7, 2009, we listed 389 institutions with $276 billion in assets, and now the list has 844 institutions and $412 billion in assets.
The red dots are the number of banks on the official problem bank list as announced in the FDIC quarterly banking profile for Q2 2009 through Q2 2010. The dots are lagged one month because of the delay in announcing formal actions.
The unofficial count is close to the official count (the difference is mostly timing issues), and the FDIC will probably have close to 1,000 banks on the list by the end of the year.
NFIB: Small Businesses Still Not Hiring
by Calculated Risk on 9/03/2010 08:15:00 PM
From NFIB: Small Businesses Still Not Hiring
William C. Dunkelberg, chief economist for the National Federation of Independent Business [said] “In August, most firms did not change employment, but for those that did, 11 percent (up one point from July) increased average employment by 2.3 employees, but 13 percent (down two points) reduced their workforces by an average of 3.5 workers. Job creation still has not crossed the 0 line in the small business sector.Note: A large percentage of small businesses are in real estate related fields and that will keep hiring down for some time. The August survey will be released on Sept 14th, but once again the key problem is "weak sales".
...
“Over the next three months, 13 percent plan to reduce employment (up three points), and 8 percent plan to create new jobs (down one point), yielding a seasonally adjusted net 1 percent of owners planning to create new jobs, a point worse than July, but at least it’s positive.
“Overall, the job creation picture is still bleak. Weak sales and uncertainty about the future continue to hold back any commitments to growth, hiring or capital spending."
Earlier employment posts today (with many graphs):



