 RSS Feed
 by Calculated Risk on 8/28/2010 01:05:00 PM
Saturday, August 28, 2010
Employment Report Preview: Will the unemployment rate spike higher?
The August employment report will be released next Friday, Sept 3rd. The consensus is for the loss of around 90,000 payroll jobs, and an increase in the unemployment rate to 9.6% (from 9.5% in July).
The decennial Census will subtract about 116,000 payroll jobs in August (estimate here), so the consensus is for about +26,000 payroll jobs ex-Census.
I will take the under on the number of payroll jobs. I think it is possible that we will see a negative payroll number, ex-Census, because of weak private hiring combined with state and local layoffs.
And I will also take the over on the unemployment rate. Here is why:
The unemployment rate is from the household survey, and is impacted by the participation rate - the percent of the civilian population in the labor force. The following graph shows the sharp decline in the participation rate during the current employment recession.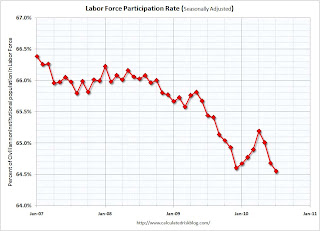 Click on graph for larger image in new window.
Note: y-axis starts at 64% to show the change.
The increase in the participation rate earlier this year was good news. This meant some workers who had given up were rejoining the labor force. The increase in the participation rate pushed up the unemployment rate, since the economy wasn't adding jobs fast enough to employ all the workers rejoining the labor force. But it was still good news that the participation rate was increasing.
However it was bad news when the participation rate started falling again over the last few months. The decline in the unemployment rate - from 9.9% in April to 9.5% in June and July - was related to the decline in the participation rate. And workers leaving the labor force is not great news.
But what will happen to the participation rate in August? The first guess, with the weak economy, is that the participation rate declined further in August, putting downward pressure on the unemployment rate.
But there are two reasons I think the participation rate might have increased.
Summer teen employment: As I noted in June, the record low number of teens joining the labor force appeared to push down the seasonally adjusted participation rate (and therefore pushed down the unemployment rate). I think this will start to unwind in August. As a lower than normal number of teens leave the labor force, the seasonally adjusted teen labor force will probably increase - my guess is by 100,000 to 150,000 workers. All else being equal, this would push up the participation rate, and also push up the unemployment rate to around 9.6%.
Unemployment Benefits: At the end of July, the qualification dates for the various tiers of Federal unemployment benefits were extended through November 30th. This extension was also made retroactive to June 2nd. Some people who have given up, might rejoin the labor force to collect additional benefits. If this happens, the participation rate might increase in August - and that would push up the unemployment rate. Although the number is uncertain, if 250,000 workers rejoin the labor force to collect benefits that would push the unemployment rate to 9.7%. If 500,000 workers rejoin the labor force, plus the 125,000 from the teen adjustment, the unemployment rate would increase to around 9.9%.
As noted above, the weak economy would normally lead to a lower participation rate, but these two reasons might push the participation rate up - and that could mean a higher than expected increase in the unemployment rate.
Unofficial Problem Bank List increases to 840 institutions
by Calculated Risk on 8/28/2010 08:44:00 AM
Note: this is an unofficial list of Problem Banks compiled only from public sources.
Here is the unofficial problem bank list for August 27, 2010.
Changes and comments from surferdude808:
The Unofficial Problem Bank List grew by more than five percent this week as the FDIC released its enforcement actions for July 2010. This week, there were 28 additions and 5 removals. Also, the list was updated to reflect assets as of the second quarter. For institutions on the list since the first quarter, aggregate assets declined by $13.9 billion. With these changes, the Unofficial Problem Bank List includes 840 institutions with aggregate assets of $410.3 billion.
Removals include First National Bank and Trust of Syracuse ($58 million), Town Center Bank ($40 million), and Peoples State Bank ($26 million), which were involved in unassisted mergers during July. Other removals from action termination include Independence Bank ($352 million) and Darien Rowayton Bank ($107 million).
Among the 28 additions are TIB Bank, Naples, FL ($1.7 billion); CB&S Bank, Inc., Russellville, AL ($1.3 billion); First Bank and Trust, New Orleans, LA ($944 million); Citizens Bank of Mukwonago, Mukwonago, WI ($627 million); and First Chatham Bank, Savannah, GA ($596 million). Geographically, the additions include 5 institutions from Illinois, 4 from Florida, and 3 from Minnesota.
Next week, the FDIC likely will release the Official Problem Bank List as of June 30th.
Friday, August 27, 2010
Jim the Realtor: "Good time to be a looker"
by Calculated Risk on 8/27/2010 08:20:00 PM
Prices are falling ... and Jim the Realtor says: "You won’t hear me say it’s a great time to buy, but ... it’s a great time to look.”
U.S. Births decline in 2009
by Calculated Risk on 8/27/2010 04:03:00 PM
From the National Center for Health Statistics: Births, Marriages, Divorces, and Deaths: Provisional Data for 2009
The NCHS reports that U.S. births declined to 4.136 million in 2009, from 4.247 million in 2008. The birth rate declined to 13.5 from 13.9 in 2008 (births per 1000 total population).
Here is a long term graph of annual U.S. births through 2009 ... Click on graph for larger image in new window.
Births have declined for two consecutive years, and are now 4.2% below the peak in 2007. I suspect certain segments of the population were under stress before the recession started - like construction workers - and even more families were in distress in 2008 and 2009. Of course it takes 9 months to have a baby, so families in distress in 2009 probably put off having babies in 2010 too.
Notice that the number of births started declining a number of years before the Great Depression started. Many families in the 1920s were under severe stress long before the economy collapsed. By 1933 births were down by almost 23% from the early '20s levels.
Of course economic distress isn't the only reason births decline - look at the huge decline following the baby boom that was driven by demographics. But it is common for births to slow or decline during tough economic times in the U.S. - and that appears to be happening now.
Last year I guessed that we'd see further declines in births in 2009 (now confirmed) and probably in 2010. But I don't think the declines in births will be anything like what happened during the 1920s.
Estimate of Decennial Census impact on August payroll employment: minus 116,000
by Calculated Risk on 8/27/2010 12:49:00 PM
The Census Bureau released the weekly payroll data for the week ending August 14th this week (ht Bob_in_MA). If we subtract the number of temporary 2010 Census workers in the week containing the 12th of the month, from the same week for the previous month - this provides a close estimate for the impact of the Census hiring on payroll employment.
The Census Bureau releases the actual number with the employment report. 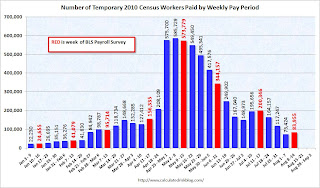 Click on graph for larger image in new window.
This graph shows the number of Census workers paid each week. The red labels are the weeks of the BLS payroll survey.
The Census payroll decreased from 200,346 for the week ending July 17th to 83,955 for the week ending August 14th.
So my estimate for the impact of the Census on August payroll employment is minus 116 thousand (this will probably be close). The employment report will be released on September 3rd, and the headline number for August - including Census numbers - will probably be negative again. But a key number will be the hiring ex-Census (so we will add back the Census workers again this month).
The following table compares the weekly payroll report estimate to the monthly BLS report on Census hiring (the weekly report is revised slightly, so the correlation looks better than in real time):
| Payroll, Weekly Pay Period | Payroll, Monthly BLS | Change based on weekly report | Actual Change (monthly) | |
|---|---|---|---|---|
| Jan | 25 | 24 | ||
| Feb | 41 | 39 | 16 | 15 |
| Mar | 96 | 87 | 55 | 48 |
| Apr | 156 | 154 | 61 | 67 |
| May | 574 | 564 | 418 | 410 |
| Jun | 344 | 339 | -230 | -225 |
| Jul | 200 | 196 | -144 | -143 |
| Aug | 84 | -116 | ||
| All thousands | ||||


