 RSS Feed
 by Calculated Risk on 8/26/2010 03:32:00 PM
Thursday, August 26, 2010
CoreLogic: 11 Million U.S. Properties with Negative Equity in Q2
Note that the slight decline in homeowners with negative equity was mostly due to foreclosures.
First American CoreLogic released the Q2 2010 negative equity report today.
CoreLogic reports that 11 million, or 23 percent, of all residential properties with mortgages were in negative equity at the end of the second quarter of 2010, down from 11.2 million and 24 percent from the first quarter of 2010. Foreclosures, rather than meaningful price appreciation, were the primary driver in the change in negative equity. An additional 2.4 million borrowers had less than five percent equity. Together, negative equity and near negative equity mortgages accounted for nearly 28 percent of all residential properties with a mortgage nationwide.From the report:
...
"Negative equity continues to both drive foreclosures and impede the housing market recovery. With nearly 5 million borrowers currently in severe negative equity, defaults will remain at a high level for an extended period of time," said Mark Fleming, chief economist with CoreLogic.
Negative equity remains concentrated in five states: Nevada, which had the highest percentage negative equity with 68 percent of all of its mortgaged properties underwater, followed by Arizona (50 percent), Florida (46 percent), Michigan (38 percent) and California (33 percent). The declines were primarily due to foreclosures, not the stabilization or small increases in prices in some markets. The largest decrease in negative equity occurred among those with loan-to-value (LTV) ratios in excess of 125 percent, where the number of negative equity borrowers fell to 4.8 million, down from 5 million last quarter.
 Click on image for larger graph in new window.
This graph shows the negative equity and near negative equity by state.
Although the five states mentioned above have the largest percentage of homeowners underwater, 10 percent or more of homeowners with mortgages in 33 states and the D.C. have negative equity.
Note: Louisiana, Maine, Mississippi, South Dakota, Vermont, West Virginia and Wyoming are NA on the graph above.
CoreLogic also released a negative equity report for 164 metro areas (excel file) (with a minimum of 50,000 mortgages). Las Vegas is at the top with 72.8% of homeowners with mortgages in negative equity (another 3.3% are close) - and the top of the list is dominated by Nevada, California, Arizona and Florida - but it is amazing how widespread the problem is!
Even with foreclosures reducing the number of negative equity mortgages, I expect the number of homeowners with negative equity will increase as prices fall later this year.
MBA Q2 2010: 14.42% of Mortgage Loans Delinquent or in Foreclosure
by Calculated Risk on 8/26/2010 01:30:00 PM
The MBA reports that 14.42 percent of mortgage loans were either one payment delinquent or in the foreclosure process in Q2 2010 (seasonally adjusted). This is down slightly from the record 14.69 percent in Q1 2010.
From the MBA: Delinquencies and Foreclosure Starts Decrease in Latest MBA National Delinquency Survey
The delinquency rate for mortgage loans on one-to-four-unit residential properties dropped to a seasonally adjusted rate of 9.85 percent of all loans outstanding as of the end of the second quarter of 2010, a decrease of 21 basis points from the first quarter of 2010, and an increase of 61 basis points from one year ago, according to the Mortgage Bankers Association’s (MBA) National Delinquency Survey.Note: 9.85% (SA) and 4.57% equals 14.42%.
...
The percentage of loans in the foreclosure process at the end of the second quarter was 4.57 percent, a decrease of six basis points from the first quarter of 2010, but an increase of 27 basis points from one year ago.
Much was made at the end of 2009 about the decline in the 30 day delinquency "bucket" (percent of loans between 30 and 60 days delinquent). Unfortunately the seasonally adjusted 30 day delinquency rate increased again in Q2 2010.
And much was made on the conference call this morning about the declines in the other "buckets", however the total percent of loans delinquent or in the foreclosure process declined only slightly in Q2 from Q1 - and is the second highest on record.
Note: there are some questions about the seasonal adjustment, especially for the 90 day bucket since we've never seen numbers this high before, but the adjustment for the 30 and 60 day periods are probably reasonable.
 Click on graph for larger image in new window.
Loans 30 days delinquent increased to 3.51%, and this is about the same levels as in Q4 2008 (slightly below the peak of 3.77% in Q1 2009).
Delinquent loans decreased in all other buckets - especially in the 90+ day bucket. MBA Chief Economist Jay Brinkmann suggested the decline in the 90+ day bucket was because of some successful modifications - since the lenders reported the loans as delinquent until the modification was made permanent.
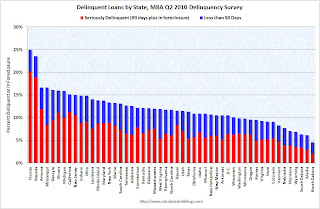 The second graph shows the delinquency rate by state (red is seriously delinquent: 90+ days or in foreclosure, blue is delinquent less than 90 days).
 Clearly Florida and Nevada have a large percentage of loans delinquent or in foreclosure. But the delinquency problem is widespread with 36 states and D.C. all having total delinquency rates above 10%.
When asked if he expected the slight improvements to continue, Brinkmann said "Improvements are more of a hope". He said the problem is jobs, and he is revising down his economic forecasts. He also the improvement in the 90+ day bucket might be because of modifications - and that might not continue.
With house prices falling - and growth slowing - the delinquency rate will probably increase later this year.
Kansas City Fed: Manufacturing activity slowed in August
by Calculated Risk on 8/26/2010 11:25:00 AM
Usually I don't post all the regional manufacturing surveys, but it appears manfuacturing is slowing right now - and the regional surveys provide early clues ...
From the Kansas City Fed:
Tenth District manufacturing activity slowed in August, and producers were somewhat less optimistic than in previous months.This is the lowest level for the Kansas City survey since August 2009.
...
The net percentage of firms reporting month-over-month increases in production in August was 0, down from 14 in July ... The shipments, new orders, and employment indexes dropped into negative territory, and the order backlog index slipped from -2 to -16.
Yesterday I compared the ISM PMI (to be released next week) with the regional Fed surveys, and based on these surveys, I expect the PMI to fall further in August.
Note on MBA: I'll post analysis of the MBA Q2 delinquency data after I receive the material (some sort of glitch this morning).
MBA Q2 National Delinquency Survey Conference Call
by Calculated Risk on 8/26/2010 11:06:00 AM
On the MBA conference call concerning the "Q2 2010 National Delinquency Survey", MBA Chief Economist Jay Brinkmann said this morning:
From MarketWatch: Foreclosure inventory down, new delinquencies up
The percentage of mortgage loans somewhere in the foreclosure process was 4.57% in the second quarter, down from 4.63% in the first quarter; the percentage is still up from 4.3% a year ago. However, the percent of loans one payment behind is now a seasonally adjusted 3.51%, said Jay Brinkmann, the MBA's chief economistNote: I have not received the press release or materials. Hopefully I'll have more later today.
Weekly initial unemployment claims decline, 4-week average highest since Nov 2009
by Calculated Risk on 8/26/2010 08:30:00 AM
The DOL reports on weekly unemployment insurance claims:
In the week ending Aug. 21, the advance figure for seasonally adjusted initial claims was 473,000, a decrease of 31,000 from the previous week's revised figure of 504,000. The 4-week moving average was 486,750, an increase of 3,250 from the previous week's revised average of 483,500.
The advance number for seasonally adjusted insured unemployment during the week ending Aug. 14 was 4,456,000, a decrease of 62,000 from the preceding week's revised level of 4,518,000.
 Click on graph for larger image in new window.
This graph shows the 4-week moving average of weekly claims since January 2000.
The dashed line on the graph is the current 4-week average. The four-week average of weekly unemployment claims increased this week by 3,250 to 486,750. This is the highest level since November 2009.
Weekly claims are very volatile, and most people follow the 4-week average to smooth out the weekly noise. It is good news that the number of initial claims declined from last week, but the level of claims - and the 4-week average - suggests a weak job market.


