 RSS Feed
 by Calculated Risk on 8/03/2010 02:23:00 PM
Tuesday, August 03, 2010
Pending and Existing Home Sales
Here is a graph of the NAR's Pending Home Sales index (left axis) and existing home sales (left axis on a seasonally adjusted annual rate basis): Click on graph for large image.
Note: the scale doesn't start at zero to better show the change.
A few key points:
1) The Pending Home sales index leads existing home sales by about 45 days.
2) The peaks in the Pending Home sales index are related to the home buyer tax credit. For the 2nd tax credit, the peak for the pending index was much higher than the existing home sales spike. One reason is that short sales sometimes take longer to close - and since the tax credit closing date was extended, these sales will close later. But probably the more important reasons are: a) appraisals are coming in below the agreed upon price, because the asking prices for similar homes have fallen since the end of April, and b) some buyers put in offers on two homes to beat the tax credit deadline, and then decided which house to buy.
3) It is hard to tell from the Pending Home sales index how far existing home sales will fall in July and August. However, with the Pending home sales index below the lows of early 2009, a first guess might be 4.5 million or so. (Existing home sales in Jan 2009 were 4.49 million SAAR).
4) With July inventory of about 4 million units and sales of 4.5 million units (SAAR), the months-of-supply will be just under 11 months and that will put downward pressure on prices. (see Existing Homes: Double Digit Months-of-Supply Watch )
General Motors: Sales up sharply compared to July 2009
by Calculated Risk on 8/03/2010 11:00:00 AM
From General Motors: Chevrolet-Buick-GMC-Cadillac Sales Up 25 Percent in July.
General July sales for Chevrolet, Buick, GMC and Cadillac increased by a combined 25 percent to 199,432 units.There was one more selling day in July 2010, so this increase is overstated a little. Note: this is just these brands too.
Note: in July 2009 U.S. light vehicle sales rose to 11.2 million (SAAR) from 9.7 million (SAAR) in June 2009. This increase was related to "Cash-for-clunkers". General Motors didn't emerge from bankruptcy until July 10, 2009, so GM will probably have the best year-over-year comparison of the major automakers.
I'll add reports from the other major auto companies as updates to this post.
Update 1: From MarketWatch: Ford U.S. July sales up 3.1% to 170,411 vehicles
Update 2: From MarketWatch: Chrysler U.S. July sales rise 5% to 93,313 units
Update 3: From MarketWatch: Toyota U.S. July sales fall 3.2% to 169,224 units
NOTE: Once all the reports are released, I'll post a graph of the estimated total July sales (SAAR: seasonally adjusted annual rate) - usually around 4 PM ET. Most estimates are for an increase to 11.6 to 11.8 million SAAR in July from the 11.1 million SAAR in June.
Pending Home fall to record series low in June
by Calculated Risk on 8/03/2010 10:02:00 AM
From the NAR: Pending Home Sales Ease in Post-Tax Credit Market
The Pending Home Sales Index, a forward-looking indicator, declined 2.6 percent to 75.7 based on contracts signed in June from an upwardly revised level of 77.7 in May [revised from 77.6], and is 18.6 percent below June 2009 when it was 93.0. The data reflects contracts and not closings, which normally occur with a lag time of one or two months.This decline was expected and suggests existing home sales - reported at closing - will fall sharply in July and probably a little further in August.
NAR chief economist Lawrence Yun says: “Over the short term, inventory will look high relative to home sales."
Yes, the months-of-supply will be in double digits, and that will put downward pressure on prices.
Note: This is a record low for this series that started in 2001.
Personal Income, Spending flat in June
by Calculated Risk on 8/03/2010 08:30:00 AM
From the BEA: Personal Income and Outlays, June 2010
Personal income increased $3.0 billion, or less than 0.1 percent ... Personal consumption expenditures (PCE) decreased $2.9 billion, or less than 0.1 percent.
...
Real PCE -- PCE adjusted to remove price changes -- increased 0.1 percent in June, compared with an increase of 0.2 percent in May.
...
Personal saving as a percentage of disposable personal income was 6.4 percent in June
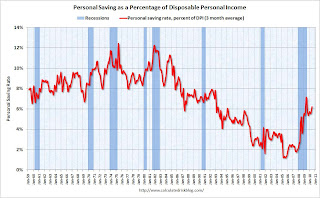 Click on graph for large image.
This graph shows the saving rate starting in 1959 (using a three month trailing average for smoothing) through the June Personal Income report. The saving rate increased to 6.4% in June (increased to 6.2% using a three month average).
I expect the saving rate to rise some more over the next year, perhaps to 8% or so - keeping the pace of PCE growth below income growth. But the good news is the saving rate is much higher than orginally estimated, so much of the expected drag from an increase in the saving rate has already happened.
Monday, August 02, 2010
WSJ: FOMC considering reinvesting when MBS Matures
by Calculated Risk on 8/02/2010 11:59:00 PM
From Jon Hilsenrath at the WSJ: Fed Mulls Symbolic Shift
Federal Reserve officials will consider a modest but symbolically important change in the management of their massive securities portfolio ...This seems unlikely to happen at the Aug 10th meeting based on Chairman Bernanke's speech this morning, and his testimony to Congress less than two weeks ago.
The issue: Whether to use cash the Fed receives when its mortgage-bond holdings mature to buy new mortgage or Treasury bonds, instead of allowing its portfolio to shrink gradually, as it is expected to do in the months ahead. ...
Buying new bonds with this stream of cash from maturing bonds—projected at about $200 billion by 2011—would show the public and markets that the Fed is seeking ways to support economic growth.


