 RSS Feed
 by Calculated Risk on 7/21/2010 01:50:00 PM
Wednesday, July 21, 2010
Live Feeds: Bernanke Testimony at 2 PM ET
Here are two live feeds for Fed Chairman Ben Bernanke's testimony to the Senate Banking Committee: The Semiannual Monetary Policy Report to the Congress
Here is the CNBC feed.
Here is the C-Span3 Link
Prepared testimony: Semiannual Monetary Policy Report to the Congress
Existing Homes: Months of Supply and House Prices
by Calculated Risk on 7/21/2010 12:08:00 PM
Earlier I mentioned that a normal housing market usually has under 6 months of supply. The NAR reported that months of supply was at 8.3 months in May, and the months of supply was probably be higher in June (to be reported tomorrow).
A quick estimate: If sales are 5.3 million (SAAR) in June, and inventory stays the same at 3.9 million units, the months of supply will rise to 8.8 months in June.
This is calculated as: 3.9 divided by 5.3 * 12 (months) = 8.8 months of supply.
For July, if sales fall to 4.5 million (it could be lower) and inventory is still at 3.9 million units, months of supply will rise to 10.4 months.
I think these estimates are conservative (actual will probably be higher). For reference, the all time record high was 11.2 months of supply in 2008.
This level of supply will put additional downward pressure on house prices. Click on graph for larger image in new window.
This graph show months of supply and the annualized change in the Case-Shiller Composite 20 house price index.
Below 6 months of supply (blue line) house prices are typically rising (black line).
Above 6 or 7 months of supply house prices are usually falling (although there were many programs to support house prices over the last year).
The dashed red line is the estimate for months of supply in June and July.
This is a key reason why I expect house prices to fall further later this year as measured by the Case-Shiller and CoreLogic repeat sales house price indexes.
WSJ: Housing Market Stumbles
by Calculated Risk on 7/21/2010 08:55:00 AM
Nick Timiraos and Robbie Whelan write at the WSJ Housing Market Stumbles. A few excerpts:
The Wall Street Journal's quarterly survey of housing-market conditions in 28 major metropolitan areas shows that inventory levels have grown in many markets.A few comments:
... newly signed contracts in May and June have plunged. ...
More broadly, the housing market faces two big problems: too many homes and falling demand.
MBA: Mortgage Purchase Applications increase slightly last week
by Calculated Risk on 7/21/2010 07:43:00 AM
The MBA reports: Interest Rate Drops Spur Refinance Applications in Latest MBA Weekly Survey
The Refinance Index increased 8.6 percent from the previous week and was the highest Refinance Index observed in the survey since the week ending May 15, 2009.
...
The seasonally adjusted Purchase Index increased 3.4 percent from one week earlier, driven by an 8.0 percent increase in government purchase applications.
...
"As rates on 30- and 15-year fixed-rate mortgages declined to the lowest levels recorded in the survey, refinance activity increased last week. The refinance index is up almost 30 percent over the past 4 weeks, but is still well below the peak seen last spring,” said Michael Fratantoni, MBA’s Vice President of Research and Economics.
...
The average contract interest rate for 30-year fixed-rate mortgages decreased to 4.59 percent from 4.69 percent, with points increasing to 1.04 from 0.96 (including the origination fee) for 80 percent loan-to-value (LTV) ratio loans. This was the lowest 30-year contract rate ever recorded in the survey.
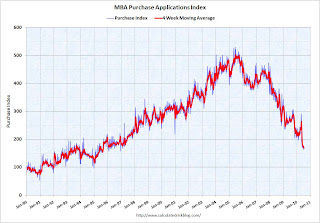 Click on graph for larger image in new window.
This graph shows the MBA Purchase Index and four week moving average since 1990.
Although the weekly applications index increased slightly, the four-week moving average is at a 15 year low (lowest since August 1995). The four week average is off 36% since the mini-peak in April (the weekly index is off 42% since the end of April).
This collapse in the mortgage application index has already shown up as a decline in new home sales, and will show up in the July and August existing home sales reports (counted at close of escrow).
Tuesday, July 20, 2010
Quick Update: Bernanke rescheduled to 2 PM ET
by Calculated Risk on 7/20/2010 10:08:00 PM
The Semiannual Monetary Policy Report to the Congress 02:00 PM - 05:00 PM ET


