 RSS Feed
 by Calculated Risk on 6/23/2010 02:15:00 PM
Wednesday, June 23, 2010
FOMC Statement: Less Positive
The comments on the economy were slightly more negative than last meeting. The Fed noted the financial issues in Europe, and also commented that "underlying inflation has trended lower". Each statements was slightly less positive ...
From the Fed:
Information received since the Federal Open Market Committee met in April suggests that the economic recovery is proceeding and that the labor market is improving gradually. Household spending is increasing but remains constrained by high unemployment, modest income growth, lower housing wealth, and tight credit. Business spending on equipment and software has risen significantly; however, investment in nonresidential structures continues to be weak and employers remain reluctant to add to payrolls. Housing starts remain at a depressed level. Financial conditions have become less supportive of economic growth on balance, largely reflecting developments abroad. Bank lending has continued to contract in recent months. Nonetheless, the Committee anticipates a gradual return to higher levels of resource utilization in a context of price stability, although the pace of economic recovery is likely to be moderate for a time.The key language about rates stayed the same: "The Committee ... continues to anticipate that economic conditions, including low rates of resource utilization, subdued inflation trends, and stable inflation expectations, are likely to warrant exceptionally low levels of the federal funds rate for an extended period."
Prices of energy and other commodities have declined somewhat in recent months, and underlying inflation has trended lower. With substantial resource slack continuing to restrain cost pressures and longer-term inflation expectations stable, inflation is likely to be subdued for some time.
The Committee will maintain the target range for the federal funds rate at 0 to 1/4 percent and continues to anticipate that economic conditions, including low rates of resource utilization, subdued inflation trends, and stable inflation expectations, are likely to warrant exceptionally low levels of the federal funds rate for an extended period.
The Committee will continue to monitor the economic outlook and financial developments and will employ its policy tools as necessary to promote economic recovery and price stability.
Voting for the FOMC monetary policy action were: Ben S. Bernanke, Chairman; William C. Dudley, Vice Chairman; James Bullard; Elizabeth A. Duke; Donald L. Kohn; Sandra Pianalto; Eric S. Rosengren; Daniel K. Tarullo; and Kevin M. Warsh. Voting against the policy action was Thomas M. Hoenig, who believed that continuing to express the expectation of exceptionally low levels of the federal funds rate for an extended period was no longer warranted because it could lead to a build-up of future imbalances and increase risks to longer-run macroeconomic and financial stability, while limiting the Committee’s flexibility to begin raising rates modestly.
Estimate of June Decennial Census impact on payroll employment: minus 243,000
by Calculated Risk on 6/23/2010 12:16:00 PM
The Census Bureau released the weekly payroll data for the week ending June 12th this morning (ht Bob_in_MA). If we subtract the number of temporary 2010 Census workers in the week containing the 12th of the month, from the same week for the previous month - this provides a close estimate for the impact of the Census hiring on payroll employment.
The Census Bureau releases the actual number with the employment report. 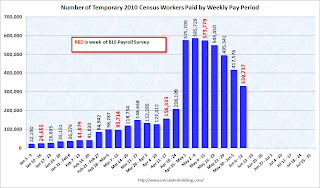 Click on graph for larger image in new window.
This graph shows the number of Census workers paid each week. The red labels are the weeks of the BLS payroll survey.
The Census payroll decreased from 573,779 for the week ending May 15th to 330,737 for the week ending June 12th.
So my estimate for the impact of the Census on June payroll employment is minus 243 thousand (this will be close). The employment report will be released on July 2nd, and the headline number for June - including Census numbers - will almost certainly be negative. But a key number will be the hiring ex-Census (so we will add back the Census workers this month).
New Home Sales collapse to Record Low in May
by Calculated Risk on 6/23/2010 10:00:00 AM
The Census Bureau reports New Home Sales in May were at a seasonally adjusted annual rate (SAAR) of 300 thousand. This is a sharp decrease from the revised rate of 446 thousand in April (revised from 504 thousand). Click on graph for larger image in new window.
The first graph shows monthly new home sales (NSA - Not Seasonally Adjusted).
Note the Red columns for 2010. In May 2010, 28 thousand new homes were sold (NSA). This is a new record low.
The previous record low for the month of May was 34 thousand in 2009; the record high was 120 thousand in May 2005. The second graph shows New Home Sales vs. recessions for the last 45 years.
Sales of new single-family houses in May 2010 were at a seasonally adjusted annual rate of 300,000 ... This is 32.7 percent (±9.9%) below the revised April rate of 446,000 and is 18.3 percent (±13.0%) below the May 2009 estimate of 367,000.And another long term graph - this one for New Home Months of Supply.
 Months of supply increased to 8.5 in May from 5.8 April. The all time record was 12.4 months of supply in January 2009. Since the sales rate declined sharply, the months of supply increased - this is still very high (less than 6 months supply is normal).
 The seasonally adjusted estimate of new houses for sale at the end of May was 213,000. This represents a supply of 8.5 months at the current sales rate.
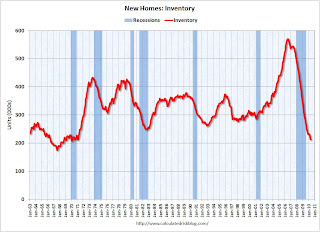 The final graph shows new home inventory.
 New home sales are counted when the contract is signed, so the tax credit related pickup in sales activity happened in April. This pulled demand forward, and April was probably the peak for new home sales this year.
The 300 thousand annual sales rate is a new all time record low. The previous record low annual sales rate was 338 thousand in September 1981.
MBA: Mortgage Purchase Applications Decrease in Weekly Survey
by Calculated Risk on 6/23/2010 07:55:00 AM
The MBA reports: Mortgage Applications Decrease in Latest MBA Weekly Survey
The Refinance Index decreased 7.3 percent from the previous week and the seasonally adjusted Purchase Index decreased 1.2 percent from one week earlier.
...
The average contract interest rate for 30-year fixed-rate mortgages decreased to 4.75 percent from 4.82 percent, with points increasing to 1.07 from 0.89 (including the origination fee) for 80 percent loan-to-value (LTV) ratio loans. This is the lowest 30-year contract rate observed in the survey since the week ending May 15, 2009.
 Click on graph for larger image in new window.
This graph shows the MBA Purchase Index and four week moving average since 1990.
The purchase index has collapsed following the expiration of the tax credit suggesting home sales will fall sharply too. This is the lowest level for 4-week average of the purchase index since February 1997.
Tuesday, June 22, 2010
AIA: Architecture Billings Index declines in May
by Calculated Risk on 6/22/2010 11:59:00 PM
Note: This index is a leading indicator for Commercial Real Estate (CRE) investment.
Reuters reports that the American Institute of Architects’ Architecture Billings Index declined to 45.8 in May from 48.5 in April. Any reading below 50 indicates contraction.
The ABI press release is not online yet. Click on graph for larger image in new window.
This graph shows the Architecture Billings Index since 1996. The index has remained below 50, indicating falling demand, since January 2008.
Note: Nonresidential construction includes commercial and industrial facilities like hotels and office buildings, as well as schools, hospitals and other institutions.
This suggests the slump for commercial real estate design is ongoing. According to the AIA, there is an "approximate nine to twelve month lag time between architecture billings and construction spending" on non-residential construction. So there will probably be further declines in CRE investment through all of 2010, and probably well into 2011.


