 RSS Feed
 by Calculated Risk on 6/18/2010 09:10:00 PM
Friday, June 18, 2010
Bank Failure #83: Nevada Security Bank, Reno, Nevada
Silver State institution
Sugar-coat veneer
by Soylent Green is People
From the FDIC: Umpqua Bank, Roseburg, Oregon, Assumes All of the Deposits of Nevada Security Bank, Reno, Nevada
As of March 31, 2010, Nevada Security Bank had approximately $480.3 million in total assets and $479.8 million in total deposits ... The FDIC estimates that the cost to the Deposit Insurance Fund (DIF) will be $80.9 million. ... Nevada Security Bank is the 83rd FDIC-insured institution to fail in the nation this year, and the third in Nevada. The last FDIC-insured institution closed in the state was Sun West Bank, Las Vegas, on May 28, 2010.Friday wasn't cancelled ...
CoreLogic: House Prices increase 0.8% in April
by Calculated Risk on 6/18/2010 07:20:00 PM
From CoreLogic (formerly First American LoanPerformance): CoreLogic® Home Price Index Shows Year-Over-Year and Month-Over-Month Increase
National home prices increased in April, the second consecutive monthly increase. According to the CoreLogic HPI, national home prices, including distressed sales, increased by 2.6 percent in April 2010 compared to April 2009. This was an improvement over March’s yearover-year price increase of 2.3 percent. Excluding distressed sales, year-over-year prices increased in April by 2.2 percent; an improvement over the March non-distressed HPI which increased by 1.0 percent year-over-year.
On a month-over-month basis, the national average home price index increased by 0.8 percent in April 2010 compared to March 2010, which was stronger than the previous one-month increase of 0.1 percent from February to March.
...
“The monthly increase in the HPI shows the lingering effects of the homebuyer tax credit,” said Mark Fleming, chief economist for CoreLogic. “We expect that we will see home prices remain strong through early summer, but in the second half of the year we expect price growth to soften and possibly decline moderately.”
 Click on graph for larger image in new window.
 This graph shows the national LoanPerformance data since 1976. January 2000 = 100.
The index is up 2.6% over the last year, and off 29.5% from the peak.
House prices are off 3.5% from the recent peak in August 2009 (although some of the decline might be seasonal). The index bottomed in March 2009 ... and the index is up 3.1% since then.
CoreLogic expects prices to "soften and possibly decline moderately". I expect that we will see lower prices on this index later this year.
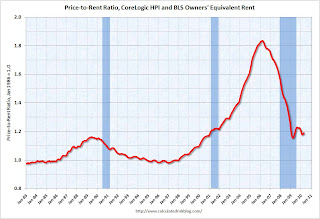 The second graph is an update on the price-to-rent ratio similar to the approach used by Fed economist John Krainer and researcher Chishen Wei in 2004: House Prices and Fundamental Value. Kainer and Wei presented a price-to-rent ratio using the OFHEO house price index and the Owners' Equivalent Rent (OER) from the BLS.
This graph shows the price to rent ratio using the CoreLogic data (January 2000 = 1.0).
This suggests that house prices are much closer to the bottom than the top, but that prices still have a ways to fall on a national basis.
Lumber Prices off 30% since April
by Calculated Risk on 6/18/2010 03:39:00 PM
By request, a graph of lumber prices ... Click on graph for larger image in new window.
From the NAHB, framing lumber prices have collapsed since the end of April.
This graph shows two measures of lumber prices: 1) from Random Lengths (via NAHB), and 2) CME futures.
With so many mills shut down during the bust, the supply of lumber was way down - and prices surged early this year. Now that construction has slowed, prices have collapsed.
Obama urges G-20 Nations to continue stimulus; Cautions about a Double-dip
by Calculated Risk on 6/18/2010 01:25:00 PM
From President Obama: Letter from the President to G-20 Leaders
Our highest priority in Toronto must be to safeguard and strengthen the recovery. We worked exceptionally hard to restore growth; we cannot let it falter or lose strength now.He also cautioned about global imbalances:
This means that we should reaffirm our unity of purpose to provide the policy support necessary to keep economic growth strong. It is essential that we have a self-sustaining recovery that creates the good jobs that our people need. In fact, should confidence in the strength of our recoveries diminish, we should be prepared to respond again as quickly and as forcefully as needed to avoid a slowdown in economic activity.
A strong and sustainable global recovery needs to be built on balanced global demand. Significant weaknesses exist across G-20 economies. I am concerned by weak private sector demand and continued heavy reliance on exports by some countries with already large external surpluses. Our ability to achieve a durable global recovery depends on our ability to achieve a pattern of global demand growth that avoids the imbalances of the past. ... I also want to underscore that market-determined exchange rates are essential to global economic vitality. The signals that flexible exchange rates send are necessary to support a strong and balanced global economy.Obama was clearly writing about China.
Obama argued for stimulus now - while the economy is weak - and fiscal discipline over the medium term:
We need to commit to fiscal adjustments that stabilize debt-to-GDP ratios at appropriate levels over the medium term.
State Unemployment Rates: Slightly lower in May
by Calculated Risk on 6/18/2010 10:00:00 AM
From the BLS: Regional and State Employment and Unemployment Summary
Regional and state unemployment rates were slightly lower in May. Thirty-seven states and the District of Columbia recorded unemployment rate decreases over the month, 6 states had increases, and 7 states had no change, the U.S. Bureau of Labor Statistics reported today. ...
In May, nonfarm payroll employment increased in 41 states and the District of Columbia, decreased in 5 states, and was unchanged in 4 states.
...
Nevada reported the highest unemployment rate among the states, 14.0 percent in May. This is the first month in which Nevada recorded the highest rate among the states and the first time since April of 2006 that a state other than Michigan has posted the highest rate. The rate in Nevada also set a new series high. (All region, division, and state series begin in 1976.) The states with the next highest rates were Michigan, 13.6 percent; California, 12.4 percent; and Rhode Island, 12.3 percent.
emphasis added
 Click on graph for larger image in new window.
This graph shows the high and low unemployment rates for each state (and D.C.) since 1976. The red bar is the current unemployment rate (sorted by the current unemployment rate).
Sixteen states and D.C. now have double digit unemployment rates. New Jersey is close.
Nevada set a new series high at 14% and now has the highest state unemployment rate. Michigan held the top spot for over 4 years.


