 RSS Feed
 by Calculated Risk on 6/17/2010 04:02:00 PM
Thursday, June 17, 2010
European Bond Spreads continue to widen
Here are two graphs from the Atlanta Fed weekly Financial Highlights released today (graph as of June 16th): Click on graph for larger image in new window.
From the Atlanta Fed:
After initially declining in early May, sovereign debt spreads have begun widening for peripheral euro-area countries. As of June 16, the 10-year bond spread (over German bonds) stands at 640 basis points (bps) for Greece, 283 bps for Ireland, 274 bps for Portugal, and 209 bps for Spain.Note: The Atlanta Fed data is one day old. Nemo has links to the current data on the sidebar of his site.
The spread to Spanish bonds has increased 110 bps since May 11, from 1% to 2.09%, while Portuguese bond spreads are 121 bps higher during the same period.
The spreads have widened further today: Greece is up to 668 bps, Ireland 290 bps, Portugal 293 bps, and Spain 211 bps. Oh, and Hungary is up sharply to 495 bps.

Similarly, while CDS spreads declined slightly last week, they are wide relative to earlier this year.Apparently this is what IMF Managing Director Dominique Strauss-Kahn meant by "contained" last week.
Hotel Occupancy Increases
by Calculated Risk on 6/17/2010 03:03:00 PM
From HotelNewsNow.com: STR: Luxury segment leads weekly increases
Overall, the industry’s occupancy increased 8.2 percent to 65.8 percent, ADR was up 1.7 percent to US$98.55, and RevPAR rose 10.0 percent to US$64.83.Note: As I noted last week, Memorial Day was late this year. That made last week look worse than actual, and made this week look better. This is why I use the 4-week moving average.
The following graph shows the four week moving average for the occupancy rate by week for 2008, 2009 and 2010 (and a median for 2000 through 2007).
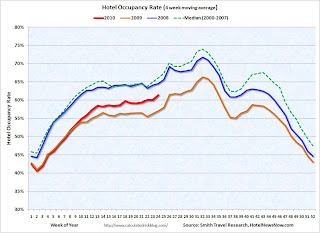 Click on graph for larger image in new window.
Notes: the scale doesn't start at zero to better show the change.
On a 4-week basis, occupancy is up 7.6% compared to last year (the worst year since the Great Depression) and still about 7% below normal.
Note: The graph shows the distinct seasonal pattern for the occupancy rate - higher in the summer because of leisure/vacation travel.
Last year leisure travel (summer) held up better than business travel, now it appears business travel is recovering - and we will soon see if leisure travel will also pick up this year.
Data Source: Smith Travel Research, Courtesy of HotelNewsNow.com
Have Residential Rents bottomed?
by Calculated Risk on 6/17/2010 01:04:00 PM
There is some evidence that apartment rents have bottomed ... at least temporarily.
The BLS reported this morning:
The shelter index increased for the first time since August 2009, rising 0.1 percent. The rise was mostly due to the index for lodging away from home, which increased 2.5 percent. The indexes for both rent and owners' equivalent rent were unchanged in May.The OER measure was up slightly and tends to lag other measures of rents.
Back in May, the NMHC reported that the market tightness index had increased sharply:
The Market Tightness Index, which measures changes in occupancy rates and/or rents, rose sharply from 38 to 81. This was the highest figure in nearly four years.There are some monthly private apartment data providers why say that rents have risen over the first 4 months of the year (on month-to-month basis, rents are still down year-over-year). They are reporting that the occupancy rate has risen slightly too.
...
“We saw a sharp increase in the Market Tightness Index, which fits with the surprisingly strong (for a seasonally weak period) effective rent growth.” [said NMHC Chief Economist Mark Obrinsky]
I spoke with a large apartment owner in Texas who told me they are seeing effective rents rising over the last few months.
I've also heard that the mood really changed at the NMHC meeting in May compared to the January meeting. There is a growing consensus among large apartment owners that rents have bottomed and the industry will rebound in 2011.
And from Dawn Wotapka the WSJ: Apartment Leases, Rents Pick Up
For the first time since the downturn, some of the nation's largest apartment-building landlords are reporting that rent declines have stopped and some are even boasting modest increases. Green Street Advisors, a real-estate research firm, says demand might have struck bottom in the first quarter ... From January through May, rents climbed 2.8% nationwide, according to Axiometrics, which tracks the national apartment market.This seems surprising given that REIS reported a record vacancy rate in Q1: "Nationally, the apartment vacancy rate stayed flat at 8%, the highest level since Reis Inc., a New York research firm, began its tally in 1980" and the Census Bureau reported the rental vacancy rate was at 10.6% in Q1, just below the all time high. Note: Reis is for large cities, the Census Bureau is nationwide.
Just something to be aware of ... rents could start falling again, but it does appear the slide has stopped for now - at least for the large apartment complexes.
Philly Fed Index "decreased notably" in June, Employment turned slightly negative
by Calculated Risk on 6/17/2010 10:00:00 AM
Here is the Philadelphia Fed Index released today: Business Outlook Survey.
The survey’s broadest measure of manufacturing conditions, the diffusion index of current activity, decreased notably from a reading of 21.4 in May to 8.0 in June. The index, which had edged higher for four consecutive months, fell back to its lowest reading in 10 months (see Chart). Although still positive and suggesting growth, indexes for new orders and shipments showed a mixed pattern this month — the new orders index increased 3 points, while the shipments index decreased 2 points. The current inventory index increased 13 points and moved back from a negative reading into positive territory, suggesting an increase in inventories this month.
Until this month, firms’ responses had been suggesting that labor market conditions were improving, but indexes for current employment and work hours were both slightly negative. For the first time in seven months, more firms reported a decrease in employment (18 percent) than reported an increase (17 percent).
emphasis added
 Click on graph for larger image in new window.
This graph shows the Philly index for the last 40 years.
The index has been positive for ten months now, but turned down "notably" in June.
This might suggest that growth in the manufacturing sector is slowing. Especially concerning is the slightly negative employment index.
Weekly Initial Unemployment Claims increase to 472,000
by Calculated Risk on 6/17/2010 08:34:00 AM
The DOL reports on weekly unemployment insurance claims:
In the week ending June 12, the advance figure for seasonally adjusted initial claims was 472,000, an increase of 12,000 from the previous week's revised figure of 460,000. The 4-week moving average was 463,500, a decrease of 500 from the previous week's revised average of 464,000.
...
The advance number for seasonally adjusted insured unemployment during the week ending June 5 was 4,571,000, an increase of 88,000 from the preceding week's revised level of 4,483,000.
 Click on graph for larger image in new window.
This graph shows the 4-week moving average of weekly claims since January 2000.
The four-week average of weekly unemployment claims decreased this week by 500 to 463,500 (the "decrease" was because last week was revised up).
The dashed line on the graph is the current 4-week average. Initial weekly claims first fell to this level in December 2009, and have been at the same level for about 6 months. The current level of 472,000 (and 4-week average of 463,500) is still high, and suggests ongoing weakness in the labor market.


