 RSS Feed
 by Calculated Risk on 6/16/2010 09:25:00 AM
Wednesday, June 16, 2010
Industrial Production, Capacity Utilization increase in May
From the Fed: Industrial production and Capacity Utilization
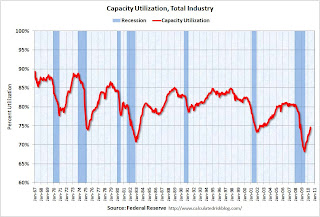
Industrial production advanced 1.2 percent in May after having risen 0.7 percent in April. Manufacturing output climbed 0.9 percent last month, its third consecutive monthly gain of about 1 percent, and was 7.9 percent above its year-earlier level. Outside of manufacturing, the output of mines edged down 0.2 percent, and the output of utilities increased 4.8 percent. The jump in utilities reflected unseasonably warm temperatures that boosted air conditioning usage in May after uncharacteristically temperate weather in April reduced heating demand. ... The capacity utilization rate for total industry rose 1.0 percentage point to 74.7 percent, a rate 6.2 percentage points above the rate from a year earlier but 5.9 percentage points below its average from 1972 to 2009.
 Click on graph for larger image in new window.
This graph shows Capacity Utilization. This series is up 9.4% from the record low set in June 2009 (the series starts in 1967).
Capacity utilization at 73.7% is still far below normal - and 7.2% below the the pre-recession levels of 80.5% in November 2007.
Note: y-axis doesn't start at zero to better show the change.
 The second graph shows industrial production since 1967.
This is the highest level for industrial production since Nov 2008, but production is still 7.9% below the pre-recession levels at the end of 2007.
Still a long way to go.
Housing Starts plummet in May
by Calculated Risk on 6/16/2010 08:30:00 AM
 Click on graph for larger image in new window.
Total housing starts were at 593 thousand (SAAR) in May, down 10% from the revised April rate of 659,000 (revised down from 672 thousand), and up 24% from the all time record low in April 2009 of 477 thousand (the lowest level since the Census Bureau began tracking housing starts in 1959).
Single-family starts collapsed 17.2% to 468,000 in May. This is 30% above the record low in January 2009 (360 thousand).  The second graph shows total and single unit starts since 1968. This shows the huge collapse following the housing bubble, and that housing starts have mostly been moving sideways for over a year.
Here is the Census Bureau report on housing Permits, Starts and Completions.
Housing Starts:Note that permits fell sharply, suggesting another significant decline in housing starts next month. This is way below expectations (I took the under!), and is good news for the housing market longer term (there are too many housing units already), but bad news for the economy and employment short term.
Privately-owned housing starts in May were at a seasonally adjusted annual rate of 593,000. This is 10.0 percent (±10.3%)* below the revised April estimate of 659,000, but is 7.8 percent (±9.7%)* above the May 2009 rate of 550,000.
Single-family housing starts in May were at a rate of 468,000; this is 17.2 percent (±7.9%) below the revised April figure of 565,000.
Building Permits:
Privately-owned housing units authorized by building permits in May were at a seasonally adjusted annual rate of 574,000. This is 5.9 percent (±2.2%) below the revised April rate of 610,000, but is 4.4 percent (±2.6%) above the May 2009 estimate of 550,000.
Single-family authorizations in May were at a rate of 438,000; this is 9.9 percent (±2.1%) below the revised April figure of 486,000. Authorizations of units in buildings with five units or more were at a rate of 117,000 in May.
MBA: Mortgage Purchase Applications increase slightly, near 13 Year Low
by Calculated Risk on 6/16/2010 07:11:00 AM
The MBA reports: Mortgage Applications Increase in Latest MBA Weekly Survey
The Refinance Index increased 21.1 percent from the previous week. This is the highest Refinance Index recorded in the survey since May 2009. The seasonally adjusted Purchase Index increased 7.3 percent from one week earlier, which is the first increase in six weeks.
...
“Mortgage applications for home purchases increased last week, the first increase in over a month. Refinance applications also picked up significantly over the week,” said Michael Fratantoni, MBA’s Vice President of Research and Economics. “While it is clear that purchase applications in May dropped sharply as a result of the tax credit induced increase in applications in April, it is unclear whether we are seeing the beginnings of a rebound now.”
...
The average contract interest rate for 30-year fixed-rate mortgages increased to 4.82 percent from 4.81 percent, with points decreasing to 0.89 from 1.02 (including the origination fee) for 80 percent loan-to-value (LTV) ratio loans.
 Click on graph for larger image in new window.
This graph shows the MBA Purchase Index and four week moving average since 1990.
The purchase index has collapsed following the expiration of the tax credit suggesting home sales will fall sharply too. This is the lowest level for 4-week average of the purchase index since February 1997.
Tuesday, June 15, 2010
Falling Euro impacts New York Real Estate market
by Calculated Risk on 6/15/2010 11:59:00 PM
From the WSJ: Currency Fall Curbs Europe's Taste for New York Property
Although there are no hard figures, the article mentions ab estimate of 15% to 20% of Manhattan condo buyers are Europeans. Apparently demand from European buyers has declined sharply.  Click on graph for larger image in new window.
This graph shows the price declines from the peak for each city included in S&P/Case-Shiller indices. Foreign buying - especially from Europeans because of the strong euro - was one of the reasons NY house prices had only fallen 21.1% from the peak.
With the weaker euro, and a substantial number of condos coming on the market later this year, prices will probably fall further in New York.
Short Sale: Agent "takes advantage" of Bank of America?
by Calculated Risk on 6/15/2010 09:28:00 PM
Jim the Realtor thinks Bank of America was taken on this deal. This 4,374 sq ft house, on two acres, is in a great location in Rancho Santa Fe (upscale San Diego). The loan was $3.2 million, and the short sale was for $1.575 million.
This was another "5 second" listing. Some agents list short sales for less than a minute to show the bank the listing ... and then keep the entire process secret. I've heard stories of sales to relatives, friends, or the listing agent just wanting both sides of the deal. If this was listed on the open market, Jim thinks it would have sold for substantially more.


