 RSS Feed
 by Calculated Risk on 6/07/2010 11:30:00 PM
Monday, June 07, 2010
Bernanke: Economy "won't feel terrific"
From Sewell Chan at the NY Times: Bernanke Forecasts a Fitful Recovery
“My best guess is that we’ll have a continued recovery, but it won’t feel terrific,” Mr. Bernanke told the broadcast journalist Sam Donaldson in a question-and-answer session at the Woodrow Wilson International Center for Scholars.The Asian markets are up somewhat tonight.
...
“Even though technically we’ll be in recovery and the economy will be growing, unemployment will still be high for a while and that means that a lot of people will be under financial stress,” he said.
The CNBC Pre-Market Data shows the S&P 500 up about 5 points and the Dow futures are up about 40 points.
The Euro is up slightly at 1.196 dollars
Best to all.
Distressed Sales: Sacramento as an Example, May 2010
by Calculated Risk on 6/07/2010 06:42:00 PM
The Sacramento Association of REALTORS® is breaking out monthly resales by equity sales (conventional resales), and distressed sales (Short sales and REO sales), and I'm following this series as an example to see mix changes in a distressed area. 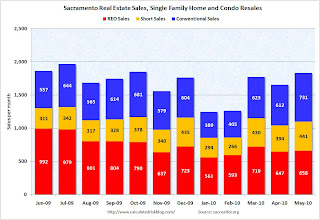 Click on graph for larger image in new window.
Here is the May data.
The Sacramento Association started breaking out REO sales in 2008, but they have only broken out short sales since June 2009 - so we now have one year of data.
In May, 60.1% of all resales (single family homes and condos) were distressed sales. This is the lowest level over the last year.
Note: This data is not seasonally adjusted.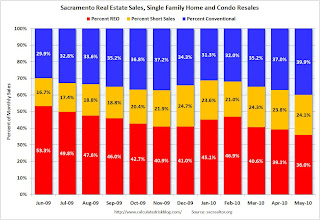 The second graph shows the percent of REO, short sales and conventional sales. The percent of short sales is near the high set in December and will probably continue to increase later this year (2010 is the year of the short sale!).
The percent of REOs has been generally declining (seasonally there are a larger percentage of REOs in the winter). Also there appears to be a higher percentage of conventional sales associated with the tax credit.
Also total sales in May were off 1.8% compared to May 2009; the 12th month in a row with declining YoY sales - even with the tax credit buying this year!
On financing, 57 percent were either all cash (23.3%) or FHA loans (33.6%), suggesting most of the activity in distressed former bubble areas like Sacramento is first time home buyers using government-insured FHA loans, and investors paying cash.
Starting in June we can do some year-over-year comparisons. It appears short sales will be up substantially YoY and REOs down, and it will be interesting to see the level of total distressed sales once the tax credit buying is behind us (July).
Rail Traffic Softens in May
by Calculated Risk on 6/07/2010 03:49:00 PM
From the Association of American Railroads: Rail Time Indicators. The AAR reports traffic in May 2010 was up 15.8% compared to May 2009 - and traffic was still 11.8% lower than in May 2008. Click on graph for larger image in new window.
This graph shows U.S. average weekly rail carloads. Traffic increased in 18 of 19 major commodity categories YoY.
From AAR:
• U.S. freight railroads originated 1,153,675 carloads in May 2010, an average of 288,419 carloads per week. That’s up 15.8% from May 2009 (which is the second highest percentage gain ever, behind April 2010 — see chart ...) but down 11.8% from May 2008.As the graph above shows, rail traffic collapsed in November 2008, and now eleven months into the recovery, traffic has only recovered about half way. This is more evidence of a sluggish recovery ... and the decline in May is concerning, although one month does not make a trend (and May was "a bit overstated" due to the timing of Memorial Day).
• U.S. railroads averaged 294,758 carloads per week in April 2010 and 288,793 in March 2010. Thus, May 2010’s average was actually down slightly from those months ... One month does not a trend make, but it would obviously be worrisome if the decline continued.
• As was the case in April 2010, the big year-over-year percentage gains in May 2010 U.S. rail traffic were partly a function of easy comparisons (May 2009 was a miserable month for rail traffic) and partly a function of real traffic growth.
• For the purposes of AAR rail traffic data, May 2010 consists of the four weeks ending May 29 — i.e., it does not include Memorial Day, which was May 31 this year. However, the May 2009 and May 2008 comparison months do include Memorial Day. The net result is that May 2010 data is a bit overstated relative to the two previous years, and June 2010 will be a bit understated relative to the two previous years. It is impossible to know exactly how much rail traffic is affected.
excerpts with permission
Consumer Credit increases slightly in April
by Calculated Risk on 6/07/2010 03:00:00 PM
The Federal Reserve reports:
Consumer credit increased at an annual rate of 1/2 percent in April 2010. Revolving credit decreased at an annual rate of 12 percent, and nonrevolving credit increased at an annual rate of 7 percent.
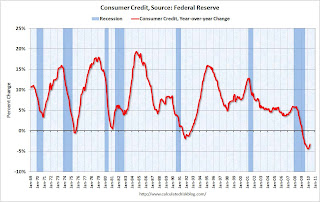 Click on graph for larger image in new window.
This graph shows the year-over-year (YoY) change in consumer credit. Consumer credit is off 3.2% over the last 12 months.
Note: The Fed reports a simple annual rate (multiplies change in month by 12) as opposed to a compounded annual rate. Consumer credit does not include real estate debt.
Usually there is a fairly sharp increase in consumer credit during a robust recovery - but that isn't happening this time because household balance sheets are still a mess. Just another reminder that the recovery will be sluggish and choppy ...
Impact of Decennial Census on Unemployment Rate
by Calculated Risk on 6/07/2010 12:00:00 PM
Last week I posted the Impact of Census 2010 on Payroll Report
My estimate was that the 2010 Census would add 417,000 payroll jobs in May; the actual was 411,000 payroll jobs.
My preliminary estimate is the Census will subtract 200,000 payroll jobs in June - and most of the remaining temporary Census jobs (564,000 total in May) will be unwound by September.
I've been puzzling over how much (if any) these temporary jobs lowered the unemployment rate in May. I think these workers come from three groups:
1) already employed workers taking a part time job,
2) people not in the workforce picking up a little temporary income (like retirees or students who would otherwise not be in the workforce), and
3) the unemployed taking a part time job.
Sure enough there was an increase in people working multiple jobs in May. The number of multiple jobholders jumped by 210,000 in May (seasonally adjusted). There can be other reasons for this increase, but if we assume these are mostly Census workers, then about half the 411,000 additional Census workers already have other jobs - so for these workers, the temporary Census jobs has no impact on the unemployment rate.
The other half are probably otherwise unemployed workers, or people not in the workforce (although the participation rate declined in May). If we assume that this is mostly unemployed workers, these temporary hires lowered the unemployment rate by around 0.1% (from 9.8% to 9.7%).


