 RSS Feed
 by Calculated Risk on 6/01/2010 08:17:00 PM
Tuesday, June 01, 2010
Fannie Mae: Serious Delinquencies decline in March
Breaking a trend ... Click on graph for larger image in new window.
Fannie Mae reported today that the rate of serious delinquencies - at least 90 days behind - for conventional loans in its single-family guarantee business decreased to 5.47% in March, down from 5.59% in February - and up from 3.13% in March 2009.
"Includes seriously delinquent conventional single-family loans as a percent of the total number of conventional single-family loans."
This is the first decline since early 2006 and could be because Fannie (and Freddie and the FHA) are moving ahead with foreclosures.
As noted last month, the combined REO (Real Estate Owned) inventory for Fannie, Freddie and the FHA increased by 22% in Q1 2010 from Q4 2009. The REO inventory (foreclosed homes) increased 59% compared to Q1 2009 (year-over-year comparison). This graph shows the REO inventory for Fannie, Freddie and FHA through Q1 2010.
Even with all the delays in foreclosure, the REO inventory has increased sharply over the last three quarters, from 135,868 at the end of Q2 2009, to 153,007 in Q3 2009, 172,357 at the end of Q4 2009 and now 209,500 at the end of Q4 2010.
These are new records for all three agencies.
Market Update
by Calculated Risk on 6/01/2010 04:33:00 PM
The euro is down to 1.2238 dollars. It has been at about this level for two weeks now ...
The TED spread increased to 39.12 (a measure of credit stress). This is still fairly low, but has been increasing steadily. Note: This is the difference between the interbank rate for three month loans and the three month Treasury. The peak was 463 on Oct 10th and a normal spread is below 50 bps.
This is a slightly different graph from Doug Short of dshort.com (financial planner).
This graph shows the ups and downs of the market since the high in 2007. The S&P 500 is now off 12.27% from the recent high.
Impact of Census 2010 on Payroll Report
by Calculated Risk on 6/01/2010 02:49:00 PM
We are starting to see articles like this from CNBC: Strong Jobs Number on Friday Could Give the Markets a Boost
Economists expect the US economy generated about 540,000 jobs in May—a large portion of which expected to come from Census hiring—and many analysts will be hoping that's enough to assuage investor fears that the European debt contagion could cause a double-dip recession.The BLS will release the May employment report on Friday. The consensus is for a gain of 540,000 payroll jobs in May, and for the unemployment rate to decline slightly to 9.8% (from 9.9%).
As the CNBC article noted, a large portion of the payroll jobs in May will be temporary hires for Census 2010 (May is the peak month). It will be important to remove the Census hiring to try to determine the underlying trend.
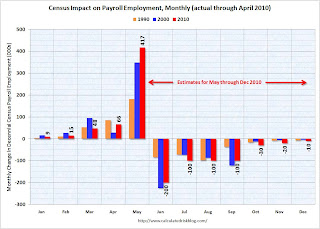
We can estimate the Census hiring using weekly payroll data from the Census bureau (ht Bob_in_MA). If we subtract the number of Temporary 2010 Census Workers in the 2nd week of May from the number in the second week of April, this suggests the Census boost will be around 417K in May. The Census Bureau will release the actual number with the employment report.
 Click on graph for larger image in new window.
This graph shows the actual impact of Census hiring in 1990, 2000, and through April 2010. The impact of the Census hiring, from May through December 2010, are my preliminary estimates.
When the employment report is released on Friday, a key number will be payroll jobs ex-Census - since the Census will probably add over 400,000 temporary payroll jobs (these are real jobs, but they mask the underlying trend). This temporary hiring will also push down the unemployment rate in May by 0.1% or 0.2% based on previous decennial Census hiring.
Most ex-Census forecasts are in the 130,000 to 150,000 range (although most forecasts only release the headline number). This would be a decrease from the 224,000 ex-Census payroll jobs in April.
Starting in June, the Census will negatively impact the payroll report. My preliminary estimate is for a decline of 200,000 Census payroll jobs in June (see graph above). If the underlying trend is a positive 200,000 payroll jobs, the headline number will be zero! And that will understate the underlying trend, just like the 500,000+ will overstate the trend in May. So we will need to adjust for the decennial Census for most of this year.
Distressed House Sales: Movin' on up!
by Calculated Risk on 6/01/2010 12:58:00 PM
From Carolyn Said at the San Francisco Chronicle: Foreclosures shifting to affluent ZIP codes
Foreclosures are going upscale across the Bay Area. ... Even more striking is the growth of mortgage defaults - the first step in the foreclosure process - in affluent ZIP codes.Option ARMs were very popular in the mid-to-high end bubble areas.
While the high-end numbers are far shy of the massive wave of lower-priced foreclosures, the growth reflects a significant shift in the foreclosure landscape ... Mortgage distress has moved upstream in part because of economic conditions ... Also in play [are] option ARM (adjustable rate mortgage) that's just beginning to cause problems.
Previous Chronicle analyses have found that option ARMs were heavily used in the Bay Area, accounting for 20 percent of all homes bought or refinanced here from 2004 to 2008. They were used for homes averaging about $823,000 in value.Although many of these loans already recast - or were refinanced - there are still quite a few that will recast over the next couple of years. Since Option ARMs were frequently used as "affordability products", many homeowners will not be able to afford the higher payments when the loans recast.
Carolyn Said also notes that banks prefer short sales to foreclosures in the mid-to-high end areas. So just tracking foreclosures doesn't tell the entire story. I'm seeing more and more high end homes listed as short sales ... and this means there are more distressed sales coming in certain mid-to-high end bubble areas and also more price declines.
Construction Spending increases in April
by Calculated Risk on 6/01/2010 10:30:00 AM
Overall construction spending increased in April, and private construction spending, both residential and non-residential, also increased in April. From the Census Bureau: April 2010 Construction at $847.3 Billion Annual Rate
The U.S. Census Bureau of the Department of Commerce announced today that construction spending during April 2010 was estimated at a seasonally adjusted annual rate of $869.1 billion, 2.7 percent (±1.4%) above the revised March estimate of $845.9 billion. The April figure is 10.5 percent (±1.6%) below the April 2009 estimate of $971.4 billion. ... Spending on private construction was at a seasonally adjusted annual rate of $565.8 billion, 2.9 percent (±1.1%) above the revised March estimate of $549.7 billion.
 Click on graph for larger image in new window.
The first graph shows private residential and nonresidential construction spending since 1993. Note: nominal dollars, not inflation adjusted.
Private residential construction spending appears to have bottomed in early 2009, but has been mostly moving sideways since then. Residential spending is now 61% below the peak of early 2006.
Private non-residential construction spending is now 29% below the peak of late 2008.
 The second graph shows the year-over-year change for private residential and nonresidential construction spending.
Nonresidential spending is off 24.6% on a year-over-year (YoY) basis.
Residential construction spending is now up 4.1% from a year ago (easy comparison), and will probably decline slightly later this year.
Private residential spending will probably exceed non-residential spending later this year - mostly because of continued declines in non-residential spending. Private construction will be a weak sector for some time.


