 RSS Feed
 by Calculated Risk on 5/27/2010 11:21:00 AM
Thursday, May 27, 2010
Next Stimulus Package Scaled Back
From Lori Montgomery at the WaPo: Bill on jobless benefits, state financial help scaled back
[C]ongressional leaders reached a tentative agreement Wednesday to scale back a package that would have devoted nearly $200 billion to jobless benefits and other economic provisions ...The "extension" of the unemployment benefits doesn't add more weeks; it extends the eligibility for the previously expanded benefits.
Under Wednesday's agreement, the overall cost of the package would drop from more than $190 billion to about $145 billion ... Unemployment benefits would be extended through the end of November, instead of through the end of the year ... $32 billion in expiring tax credits and deductions for businesses and individuals and $24 billion to help cash-strapped state governments.
The spending from the American Recovery and Reinvestment Act (ARRA) starts to decline in Q3, and that will be a drag on GDP growth. However the additional spending (including this proposed package) will probably keep the overall contribution to GDP growth slightly positive in Q3, but will be a drag on GDP growth starting in Q4 as spending declines.
Weekly Initial Unemployment Claims at 460,000
by Calculated Risk on 5/27/2010 08:30:00 AM
The DOL reports on weekly unemployment insurance claims:
In the week ending May 22, the advance figure for seasonally adjusted initial claims was 460,000, a decrease of 14,000 from the previous week's revised figure of 474,000. The 4-week moving average was 456,500, an increase of 2,250 from the previous week's revised average of 454,250.
...
The advance number for seasonally adjusted insured unemployment during the week ending May 15 was 4,607,000, a decrease of 49,000 from the preceding week's revised level of 4,656,000.
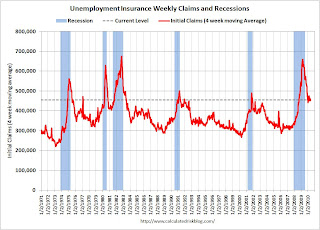 Click on graph for larger image in new window.
This graph shows the 4-week moving average of weekly claims since 1971.
The four-week average of weekly unemployment claims increased this week by 2,250 to 456,500.
The dashed line on the graph is the current 4-week average. The current level of 460,000 (and 4-week average of 456,500) is still high, and suggests ongoing weakness in the labor market.
Still disappointing ... the 4-week average has been moving sideways for almost five months.
Wednesday, May 26, 2010
Mortgage Refinance Activity
by Calculated Risk on 5/26/2010 11:33:00 PM
With the recent decline in mortgage rates, the Mortgage Bankers Association (MBA) has reported an increase in refinance activity. But so far the activity is far below the levels of early 2009 even though mortgage rates are at about the same level.
This is because most people who could refinance already did last year ... Click on graph for larger image in new window.
This graph shows the weekly MBA refinance activity, and the Ten Year Treasury yield (Note: Using the 10 year to approximate moves in mortgage rates).
Every time the 10 year yield drops sharply, refinance activity picks up. But notice what happened at the end of 1995. The Ten Year yield dropped, but the increase in refinance activity was muted. This was because mortgage rates didn't fall below the rates of a couple years earlier - and many people had already refinanced at those lower rates.
The same thing is happening now, and although activity has increased, there will only be a huge surge in refinance activity if mortgage rates fall below the rates of 2009.
Toll Brothers: Orders Up, Cancellation Rates Way Down, Toll buying Lots Again (Uh, Oh!)
by Calculated Risk on 5/26/2010 06:28:00 PM
This post is from housing economist Tom Lawler:
Toll Brothers, the self-proclaimed “leading builder of luxury homes,” reported that net home contracts totaled 866 in the quarter ended April 30th, up 40.9% from the comparable quarter of 2009. Gross orders were up 16.6% from a year ago, while sales cancellations were down 71.4%. The company’s sales cancellation rate expressed as a % of gross orders was 5.3%, the lowest rate since the third quarter of FY 2005, and close to the time that Toll CEO Robert Toll made his infamous comment in the summer of 2005 that “(w)e’ve got the supply, and the market has got the demand; it’s a match made in heaven” right before housing demand started to fall. Home deliveries last quarter totaled 543, down 16.2% from the comparable quarter of last year, while the company’s order backlog as of 4/30/10 was 1,738, up 9.9% from a year ago. The company’s increase in orders came despite a 21% drop in Toll’s community count from last year.
In its press release, new Toll CEO-designate Doug Yearley, Jr. noted that “with demand increasing in many areas, we are now focused on growth,” and said the company increased its lot count for the first time in four years – scaring more than a few folks. 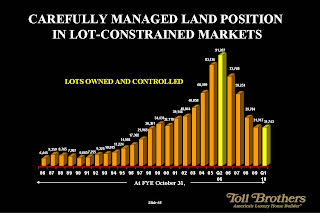 Click on graph for larger image in new window.
[This graph], by the way, is some history of Toll’s land/lot position from one of its presentations, with one of the most misleading headlines known to man.
This chart, as well as Bob Toll’s statements, highlights how Toll completely and totally misread the housing markets during the middle of last decade, accelerating land/lot acquisitions right near the peak – a move that eviscerated shareholders, though the company’s relative low leverage saved it from extinction.
What scared folks is that the company’s new push to growth was based on an assessment, echoed by Bob Toll in the press release, that the rebound in orders/demand was not simply the result of the home buyer tax credit, but was also driven “by an increase in confidence among our buyers in their job security, their ability to sell their existing homes, and general trends in home prices." He based this assessment in part on the fact that “(i)n the three weeks since the start of our third quarter on May 1st, which coincided with the expiration of the homebuyer tax credit, our per community deposits and traffic were up 23% and 11%, respectively, over last year's comparable period.”
Note, though that (1) he referenced activity per community, and the company’s community count was down 21% from a year ago, and last quarter’s YOY increase in gross orders per community were up 47.2% YOY (and net orders 78%!); and (2) a year ago wasn’t exactly a strong housing market!!!! But…you know Bob!!!!
An amusing thing in today’s press release that actually suggests the company is highly uncertain about housing demand for the rest of this year was CFO’s Joel Rassman’s “limited” guidance he offered for the company’s home deliveries in FY 2010 (which is half over). He said the company estimates that it will deliver “between 2,200 and 2,275” homes in FY2010. Given the 1,139 homes already delivered in the first half of FY 2010, that means the company’s “guidance” is that it expects to deliver between 1,061 and 1,611 homes from May 1st through October 31st !!!! Now THAT’S a huge range, and one consistent with a view that “well, I think demand may have rebounded, but BOY, maybe it really WAS the tax credit!!!”
Of course, the tax credit probably was NOT as much of a factor for buyer’s of Toll’s homes relative to other builders – after all, Toll’s average price is in the $560,000 - $570,000, and the federal tax credit was capped at $8,000. And, in fact, there IS some anecdotal evidence that in some markets the demand for “Toll-like” homes has improved a bit. However, given Bob Toll’s track record of reading the housing market since the turn of the millennium ...
Bob Toll, by the way, will step down as Toll’s CEO effective June 16th, though he will “remain active” as Executive Chairman of the Board.
CR Note: this was from economist Tom Lawler.
Market Update: More Euro
by Calculated Risk on 5/26/2010 03:40:00 PM
The euro was down under 1.22 dollars as investors apparently reacted to a story in the Financial Times: China reviews eurozone bond holdings
China ... is reviewing its holdings of eurozone debt ...And this brought out the Dow 10K hats with the Dow closing at 9.974. Party likes it's 1998!
Representatives of China’s State Administration of Foreign Exchange, or Safe ... has been meeting with foreign bankers in Beijing in recent days to discuss the issue.
Safe, which holds an estimated $630bn of eurozone bonds in its reserves ...
excerpts with permission
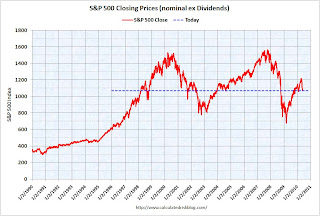 Click on graph for larger image in new window.
The first graph shows the S&P 500 since 1990.
The dashed line is the close today. The first time the S&P 500 was at this level was March 11, 1998 - over 12 years ago.
For investors this has already been a "lost decade" and more ...

This graph is from Doug Short of dshort.com (financial planner): "Four Bad Bears".
Note that the Great Depression crash is based on the DOW; the three others are for the S&P 500.


