 RSS Feed
 by Calculated Risk on 5/24/2010 09:05:00 PM
Monday, May 24, 2010
DOT: Vehicle Miles Driven increase in March
Note: On existing home sales, please see Inventory increases Year-over-Year and Existing Home Sales increase in April
The Department of Transportation (DOT) reported earlier today that vehicle miles driven in March were up from March 2009:
Travel on all roads and streets changed by +2.3% (5.8 billion vehicle miles) for March 2010 as compared with March 2009. Travel for the month is estimated to be 254.8 billion vehicle miles.So miles driven are still down for the year compared to 2009.
Cumulative Travel for 2010 changed by -0.7% (-4.8 billion vehicle miles).
Also miles driven in March were still 1.7% below March 2007.
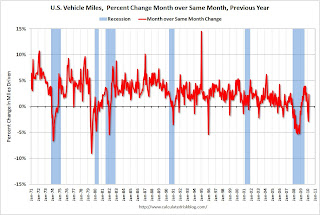 Click on graph for larger image in new window.
This graph shows the percent change from the same month of the previous year as reported by the DOT.
As the DOT noted, miles driven in March 2010 were up 2.3% compared to March 2009.
The YoY decline in February was blamed on the snow, and there might have been some extra driving in March once the weather improved. On a rolling 12 month basis, miles driven are still 2.1% below the peak - and only 0.5% above the recent low - suggesting a sluggish recovery.
FHA Commissioner: Housing on "Life support", "very sick system"
by Calculated Risk on 5/24/2010 05:55:00 PM
“This is a market purely on life support, sustained by the federal government. Having FHA do this much volume is a sign of a very sick system.”
Federal Housing Commissioner David Stevens at Mortgage Bankers Association Government Housing Conference (see Bloomberg, the FHA was involved in more transactions in Q1 than Fannie and Freddie combined)
No kidding ...
Market Update
by Calculated Risk on 5/24/2010 04:04:00 PM
Note: On existing home sales, please see Inventory increases Year-over-Year and Existing Home Sales increase in April
The market sell-off continues with the Dow down 127. The S&P 500 off 14 (1.3%).
This graph is from Doug Short of dshort.com (financial planner): "Four Bad Bears".
Note that the Great Depression crash is based on the DOW; the three others are for the S&P 500.
The Euro is down to 1.2383 dollars (off slightly).
The TED spread increased to 35.96 from 34.47. This is still fairly low, but has been increasing steadily. Note: This is the difference between the interbank rate for three month loans and the three month Treasury. The peak was 463 on Oct 10th and a normal spread is below 50 bps.
The three month dollar Libor edged up to 0.51.
'Shadow' Condos coming back on market
by Calculated Risk on 5/24/2010 02:16:00 PM
Over the weekend, Jeff Collins at the O.C. Register noted that the "Central Park West" complex in Irvine, California that was mothballed by Lennar in 2007 is now back on the market.
And from Amanda Fung at Crain's New York: 'Shadow' condos dim sale outlook (ht Nick)
A little over two years ago, SDS Procida suspended plans to market The Dillon, its 83-unit Hell's Kitchen condo, when residential real estate tanked ... the developer finally put the units on the block three weeks ago.The term "shadow inventory" is used in many different ways. My definition is: housing units that are not currently listed on the market, but will probably be listed soon. This includes:
...
“It is still early—you're not seeing a flood of apartments yet—but we may see it happen during the second half of the year,” says Jonathan Miller, chief executive of appraisal firm Miller Samuel Inc.
...
Mr. Miller estimates that there were 6,500 units of shadow space in Manhattan alone during the first quarter of this year. If those apartments were unloaded all at once, supply would potentially skyrocket by 70%.
It is difficult to put a number on the total, but it is in the millions of units and all this inventory will keep downward pressure on house prices for some time.
Existing Home Sales: Inventory increases Year-over-Year
by Calculated Risk on 5/24/2010 11:25:00 AM
Earlier the NAR released the existing home sales data for April; here are a couple more graphs ...
The first graph shows the year-over-year (YoY) change in reported existing home inventory and months-of-supply. Inventory is not seasonally adjusted, so it really helps to look at the YoY change.  Click on graph for larger image in new window.
Inventory increased 2.7% YoY in April, the first YoY increase since 2008.
This increase in the inventory is especially concerning because the reported inventory is already historically very high, and the 8.4 months of supply in April is well above normal. The months of supply will probably decline over the next two months because of the increase in sales due to the tax credit (reported at closing), but this will be something to watch this summer and later this year.
Perhaps this was an especially large surge in inventory as sellers tried to take advantage of the tax credit, but it is also possible that we will see close to double digit months of supply later this year.  The second graph shows NSA monthly existing home sales for 2005 through 2010 (see Red columns for 2010).
Sales (NSA) in April 2010 were 26% higher than in April 2009, and also higher than in April of 2007 and 2008.
We will probably see an increase in sales in May and June - perhaps to the levels of 2006 or 2007 - because of the tax credit, however I expect to see existing home sales below last year in the 2nd half of this year.
I think this was a weak report. Sales were up because of the tax credit (pulling sales forward), but that does very little for the economy. The key is the increase in the inventory and months-of-supply, and if these two measures increase later this year (after the distortions in May and June), then there will be additional downward pressure on house prices.


