 RSS Feed
 by Calculated Risk on 5/20/2010 07:52:00 PM
Thursday, May 20, 2010
Financial Reform: Final Senate Vote Soon
Update: Passed 59 to 39.
From Brady Dennis at the WaPo: Senate clears way to vote on financial reform
A final vote on the legislation could come later Thursday evening, congressional aides said. Party leaders were working to resolve a number of procedural hurdles, but it appeared that a series of votes could begin around 7:30 p.m.
"We're passing this bill tonight," said Jim Manley, spokesman to Majority Leader Harry M. Reid (D-Nev.). "We're finishing this tonight."
Market Update
by Calculated Risk on 5/20/2010 03:45:00 PM
 Click on graph for larger image in new window.
The first graph shows the S&P 500 since 1990 (this excludes dividends).
The dashed line is the closing price today. The S&P 500 was first at this level in March 1998; over 12 years ago. 
The second graph is from Doug Short of dshort.com (financial planner): "Four Bad Bears".
Note that the Great Depression crash is based on the DOW; the three others are for the S&P 500.
As an aside, once again the Shanghai composite index appeared to lead both the S&P 500 and oil prices. Not only are there issues in Europe, but China is slowing ...
Freddie Mac: Near Record Low Mortgage Rates
by Calculated Risk on 5/20/2010 02:45:00 PM
From Freddie Mac: Long- and Short-Term Mortgage Rates Fall Again This Week
Freddie Mac today released the results of its Primary Mortgage Market Survey® (PMMS®) in which the 30-year fixed-rate mortgage (FRM) averaged 4.84 percent with an average 0.7 point for the week ending May 20, 2010, down from last week when it averaged 4.93 percent. Last year at this time, the 30-year FRM averaged 4.82 percent. Once again, the 30-year FRM has not been lower since the week ending December 10, 2009, when it averaged 4.81 percent.The record low was 4.71% for the week of Dec 3, 2009 (series started in 1971).
The decline in mortgage rates is being driven by the decrease in the Treasury yield. The Ten Year treasury yield is currently at 3.26%.
 Click on graph for larger image in new window.
This graph shows the 30 year mortgage rates from the Freddie Mac survey, and the ten year Treasury yields, since January 2008.
The spread between the two series has widened slightly since the program ended.
From Bloomberg:
The difference between yields on the Fannie Mae securities and 10-year Treasuries widened 0.03 percentage point to 0.81 percentage point, Bloomberg data show. The spread reached 0.59 percentage point on March 29, the lowest on record ... The gap climbed to 0.86 percentage point May 6, after holding near that low in April.As an aside, the euro has strengthened a little and is close to 1.26 dollars today - up from 1.23 yesterday.
FDIC Q1 Banking Profile: 775 Problem Banks
by Calculated Risk on 5/20/2010 11:51:00 AM
The FDIC released the Q1 Quarterly Banking Profile today. The FDIC listed 775 banks with $431 billion in assets as “problem” banks in Q1, up from 702 banks with $403 billion in assets in Q4, and 305 banks and $220 billion in assets in Q1 of 2009.
Note: Not all problem banks will fail - and not all failures will be from the problem bank list - but this shows the problem is significant and still growing.
The Unofficial Problem Bank List shows 725 problem banks - and will continue to increase as more formal actions (or hints of pending actions) are released. Click on graph for larger image in new window.
This graph shows the number of FDIC insured "problem" banks since 1990.
All data is year end except Q1 2010.
The 775 problem banks reported at the end of Q1 is the highest since June 30, 1993, when the number of "problem" institutions totaled 793.
The FDIC is still on pace for 1,000 problem banks by the end of the year, although it also depends on how many banks are removed from the list.  The second graph shows the assets of "problem" banks since 1990.
The assets of problem banks are the highest since June 30, 1993 when the assets of "problem" institutions were $467 billion.
Philly Fed Index increases slightly in May, New orders index declines
by Calculated Risk on 5/20/2010 10:00:00 AM
Here is the Philadelphia Fed Index released today: Business Outlook Survey.
The survey’s broadest measure of manufacturing conditions, the diffusion index of current activity, increased slightly from 20.2 in April to 21.4 this month. The index has now edged higher for four consecutive months and has remained positive for the ninth consecutive month (see Chart). Although still positive and suggesting growth, indexes for new orders and shipments showed a mixed pattern this month: The new orders index fell 8 points, while the shipments index increased 10 points. The current inventory index decreased 10 points and fell into negative territory, suggesting declines in inventories. Indexes for unfilled orders and delivery times were both negative this month, suggesting some weakening in activity from April.
emphasis added
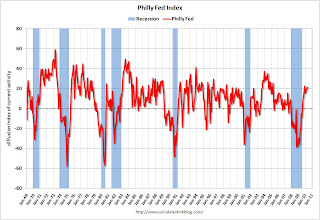 Click on graph for larger image in new window.
This graph shows the Philly index for the last 40 years.
The index has been positive for nine months now, after being negative or zero for 21 straight months.
The internals suggest manufacturing conditions are softening a little, as also suggested earlier by the New York Empire State manufacturing index.


