 RSS Feed
 by Calculated Risk on 5/07/2010 07:56:00 PM
Friday, May 07, 2010
Three Major Stories
A break from our usual Friday afternoon custom ... there were three major stories today.
1) On Europe: there is a reasonable chance of a major announcement this weekend. Earlier today there were rumors of a €600 billion loan facility for European banks. One key analyst thinks the Fed might re-open the dollar swap lines for Europe - one, or both, or something else could be announced on Sunday.
Tonight, Bloomberg is reporting: EU to Craft Financial Backstop to Prevent Spread of Crisis
Leaders of the 16 countries sharing the currency said finance ministers will meet tomorrow to hash out the details of a “stabilization mechanism to preserve the financial stability in Europe.”Krugman has the best line: O Nao!
I really really hope the ECB staff are huddling right now ... Otherwise Anno Domini 2010 is shaping up to be Anno Domino instead.2) On the Stock Market: From the SEC: Statement of the Securities and Exchange Commission and the Commodity Futures Trading Commission
“We are continuing to review the unusual trading activity that took place briefly yesterday afternoon to pinpoint its cause and contributing factors.The causes of the weird price changes still haven't been determined.
...
“Our market oversight units are reviewing trading and market data from the exchanges, self regulatory organizations and market participants to examine yesterday's unusual trading activity. We are scrutinizing the extent to which disparate trading conventions and rules across various markets may have contributed to the spike in volatility.
“We are devoting significant resources and expertise to this effort.
“As we determine the cause and contributing factors, we will make our findings and any recommendations public. ...
3) Employment Report: Usually the big story of the day would be the 290K (224K ex-Census) increase in payroll employment. Here were my earlier posts:
Bank Failures #65 & 66: Florida and Minnesota
by Calculated Risk on 5/07/2010 06:37:00 PM
Injections of capital
Could not save this bank
One thousand point drop
Ten thousand banks may yet fail
Is it time for gold?
by Soylent Green is People
From the FDIC: First Federal Bank of Florida, Lake City, Florida, Assumes All of the Deposits of The Bank of Bonifay, Bonifay, Florida
Bank of Bonifay, Bonifay, Florida, was closed today by the Florida Office of Financial Regulation, which appointed the Federal Deposit Insurance Corporation (FDIC) as receiver. ...From the FDIC: Prinsbank, Prinsburg, Minnesota, Assumes All of the Deposits of Access Bank, Champlin, Minnesota
As of March 31, 2010, The Bank of Bonifay had approximately $242.9 million in total assets and $230.2 million in total deposits. ...
The FDIC estimates that the cost to the Deposit Insurance Fund (DIF) will be $78.7 million. ... The Bank of Bonifay is the 65th FDIC-insured institution to fail in the nation this year, and the tenth in Florida. The last FDIC-insured institution closed in the state was Riverside National Bank of Florida, Fort Pierce, on April 16, 2010.
Access Bank, Champlin, Minnesota, was closed today by the Minnesota Department of Commerce, which appointed the Federal Deposit Insurance Corporation (FDIC) as receiver. ...
As of March 31, 2010, Access Bank had approximately $32.0 million in total assets and $32.0 million in total deposits. ...
The FDIC estimates that the cost to the Deposit Insurance Fund (DIF) will be $5.5 million..... Access Bank is the 66th FDIC-insured institution to fail in the nation this year, and the fifth in Minnesota. The last FDIC-insured institution closed in the state was State Bank of Aurora, Aurora, on March 19, 2010.
NMHC Quarterly Survey: Apartment Market Conditions Tighten
by Calculated Risk on 5/07/2010 04:00:00 PM
From the National Multi Housing Council (NMHC): Apartment Industry Shows Widespread Improvement According to NMHC Quarterly Survey of Market Conditions
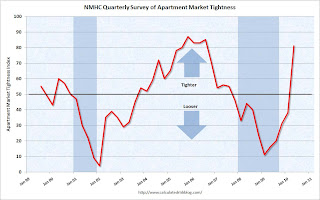
The Market Tightness Index, which measures changes in occupancy rates and/or rents, rose sharply from 38 to 81. This was the highest figure in nearly four years. Fully 64 percent of respondents said markets were tighter (meaning lower vacancies and/or higher rents). Only two percent reported looser markets. This is the sixth straight increase for this measure.
...
“We saw a sharp increase in the Market Tightness Index, which fits with the surprisingly strong (for a seasonally weak period) effective rent growth. ... Even so, a sustained recovery in the apartment market needs a firm economic and demographic foundation ... in the near-term the industry’s prospects still depend upon a stronger rebound in both the job market and household formation.” [said NMHC Chief Economist Mark Obrinsky]
Click on graph for larger image in new window.
This graph shows the quarterly Apartment Tightness Index.
A reading above 50 suggests the vacancy rate is falling. Based on limited historical data, I think this index will lead reported apartment rents by about 6 months to 1 year. Right now I expect BLS reported rents to continue to decline through most of 2010.
This data is a survey of large apartment owners. The data released last week from the Census Bureau showed a 10.6% rental vacancy rate for all rental units.
A final note: at some point the apartment market would start to tighten from the very high vacancy rates (record levels according to the Census Bureau and Reis).
The question asked was:
Q: [O]n balance, apartment market conditions in your markets today are:
Of those surveyed, 64% answered: "Tighter than three months ago" and 34% answered "About unchanged from three months ago". So it appears the bottom in vacancy rates was reached in Q4 2009.
The improvement in the labor market is probably leading to more household formation - and combined with a record low number of new apartment units being completed this year - the apartment market is now starting to tighten. It will take some time for the overall vacancy rate to fall to normal levels, but the excess housing units are now being absorbed. (See Housing Stock and Flow for an analysis of the absorption of excess housing units).
European Liquidity Issues
by Calculated Risk on 5/07/2010 01:29:00 PM
There is a rumor circulating that the ECB is prepared to announce a €600 billion loan facility for European banks over the next few days. One key analyst has suggested that the FOMC might re-open the dollar swap lines for Europe. Update: I don't usually post rumors during the day, but this is being widely circulated as a possibility.
Note that the Bank of Japan moved last night, from the Financial Times: Bank of Japan pumps funds into market
The Bank of Japan offered Y2,000bn ($21.6bn) in overnight liquidity on Friday to “increase markets’ sense of security” because of turmoil resulting from the debt crisis in Greece. ... the bank’s action reflects global demand for dollar liquidity as investors move out of the euro.And from the WSJ: European Banks Head Toward New Funding Crunch
excerpt with permission
Europe's sovereign debt crisis is making it harder for European banks to get their hands on dollars and may require their central banks to step in with short-term liquidity ...The Libor rate has increased, but it is still at a very low level. This could be something to watch.
Temporary Help and Diffusion Index
by Calculated Risk on 5/07/2010 12:51:00 PM
Here are a couple more graphs based on data in the employment report ...
Temporary Help
From the BLS report:
Temporary help services continued to add jobs (26,000); employment in this industry has increased by 330,000 since September 2009.
 This graph is a little complicated. The red line is the three month average change in temporary help services (left axis). This is shifted four months into the future.
The blue line (right axis) is the three month average change in total employment (excluding temporary help services).
Unfortunately the data on temporary help services only goes back to 1990, but it does appear that temporary help leads employment by about four months.
The thinking is that before companies hire permanent employees following a recession, employers will first increase the hours worked of current employees (hours worked increased slightly in April) and also hire temporary employees. Since the number of temporary workers increased sharply over the last seven months, some people think this might be signaling the beginning of a strong employment recovery.
However, there has been some evidence of a shift by employers to more temporary workers, and the saying may become "We are all temporary now!", so use this increase with caution.
Note that the temporary hiring for the Census is excluded from this graph.
Diffusion Index
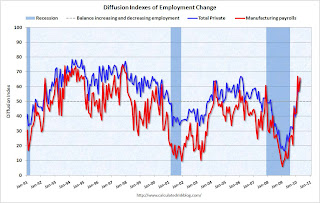 The BLS diffusion index for total private employment increased to 64.3 from 57.8 in March. This is the highest level since 2006. For manufacturing, the diffusion index is at 65.9; the highest since 1998.
Think of this as a measure of how widespread job gains are across industries. The further from 50 (above or below), the more widespread the job losses or gains reported by the BLS. From the BLS:
Figures are the percent of industries with employment increasing plus one-half of the industries with unchanged employment, where 50 percent indicates an equal balance between industries with increasing and decreasing employment.This fits with the headline payroll report and is a positive.
Earlier employment posts today:


