 RSS Feed
 by Calculated Risk on 5/03/2010 06:04:00 PM
Monday, May 03, 2010
Fed: Banks Keep Lending Standards Unchanged, Loan Demand Weakens Further
From the Fed: The April 2010 Senior Loan Officer Opinion Survey on Bank Lending Practices
The April survey indicated that most banks kept their lending standards unchanged in the first quarter, but that moderate net fractions of banks further tightened many terms on loans to businesses and households. ... The survey also indicated that loan demand generally weakened further.In general banks have stopped tightening lending standards, however demand continues to weaken. For commercial real estate, the banks are still tightening standards:
emphasis added
A significant number of domestic banks, on balance, continued to report having tightened standards on CRE loans. However, this net fraction was considerably smaller than in the January survey. As in the previous survey, domestic banks reported weaker demand for CRE loans, on net.And on a special question regarding the the use of CRE loan extensions:
In response to a special question, sizable fractions of both domestic and foreign respondents reported having increased their use of CRE loan extensions over the previous six months.This is similar to the last survey in January ... generally banks have ceased tightening lending standards (this is probably as tight as it gets for this cycle), but loan demand weakened further.
U.S. Light Vehicle Sales 11.2 Million SAAR in April
by Calculated Risk on 5/03/2010 03:28:00 PM
Based on an estimate from Autodata Corp, light vehicle sales were at a 11.21 million SAAR in April. This is up 21.8% from April 2009 (when sales were at the lowest level in 30 years), and down 4.6% from the March sales rate that was driven by incentives. Click on graph for larger image in new window.
This graph shows the historical light vehicle sales (seasonally adjusted annual rate) from the BEA (blue) and an estimate for April (red, light vehicle sales of 11.21 million SAAR from Autodata Corp). The second graph shows light vehicle sales since the BEA started keeping data in 1967.
Auto sales have recovered from the low levels of early 2009, but are still below the lowest point of the '90/'91 recession (even with a larger number of registered drivers).
This was slightly below most forecasts of around 11.5 million SAAR.
Q1: Office, Mall and Lodging Investment
by Calculated Risk on 5/03/2010 01:30:00 PM
Here are graphs of office, mall and lodging investment through Q1 2010 based on the underlying detail data released by the BEA today ...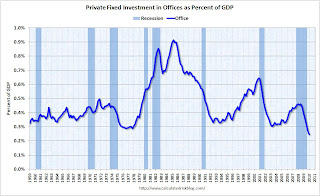 Click on graph for larger image in new window.
This graph shows investment in offices as a percent of GDP. Office investment as a percent of GDP peaked at 0.46% in Q3 2008 and has declined sharply to a new all time low (as a percent of GDP).
Reis reported that the office vacancy rate rose to the highest level since the early '90s in Q1 2010 at 17.2%, up from 17.0% in Q4 and 15.2% in Q1 2009. The peak vacancy rate following the 2001 recession was 16.9%. With the office vacancy rate still rising, office investment will probably decline further - although most of the decline in investment has already happened.
Office investment is usually the most overbuilt in a boom, but this time the office market struggled for a few years after the stock market bubble burst and there was comparatively more investment in malls and hotels. The second graph is for investment in malls.
Investment in multimerchandise shopping structures (malls) peaked in 2007 and has fallen by over 50% (note that investment includes remodels, so this will not fall to zero). Mall investment is also at an all time low (as a percent of GDP) and will probably continue to decline through 2010.
Reis reported that the mall vacancy rate in Q1 2010 was the highest on record at 8.9% for regional malls, and the highest since 1991 for strip malls.  The third graph is for lodging (hotels).
The recent boom in lodging investment was stunning. Lodging investment peaked at 0.32% of GDP in Q2 2008 and has fallen by almost 2/3rds already..
I expect lodging investment to continue to decline through at least 2010.
As projects are completed there will be little new investment in these categories for some time. Notice that investment in all three categories typically falls for a year or two after the end of a recession, and then usually recovers very slowly. Something similar will probably happen again, and there will not be a recovery in these categories until the vacancy rates fall significantly.
General Motors: Sales up 6.4% compared to April 2009
by Calculated Risk on 5/03/2010 11:09:00 AM
From MarketWatch: GM April U.S. sales up 6.4% to 183,997 vehicles and from GM: Chevrolet-Buick-GMC-Cadillac Sales Increase 20 Percent in April
Note: GM discontinued several brands, so total vehicle sales were up 6.4%.
Update: From MarketWatch: Ford U.S. April sales jump 24.7% to 167,542 units
Update2: from MarketWatch: Chrysler U.S. April sales increase 25%
Update3: from MarketWatch: Toyota U.S. April sales up 24.4% to 157,439 units
This is based on a very easy comparison: in April 2009 U.S. light vehicle sales fell 36% to 9.2 million (SAAR) from 14.4 million (SAAR) in April 2008. The sharp decline last year was due to the financial crisis, the recession, and reports of the then impending bankruptcy of GM and Chrysler (Chrysler filed for bankruptcy at the end of April, 2009, GM filed for bankruptcy on June 1, 2009).
I'll add reports from the other major auto companies as updates to this post.
NOTE: Once all the reports are released, I'll post a graph of the estimated total April sales (SAAR: seasonally adjusted annual rate) - usually around 4 PM ET. Most estimates are for a slight decrease from the 11.75 million SAAR in March.
Private Construction Spending Declines in March
by Calculated Risk on 5/03/2010 10:28:00 AM
Overall construction spending increased in March, with a boost from public spending, however private construction spending - both residential and non-residential - declined in March. From the Census Bureau: March 2010 Construction at $847.3 Billion Annual Rate
The U.S. Census Bureau of the Department of Commerce announced today that construction spending during March 2010 was estimated at a seasonally adjusted annual rate of $847.3billion, 0.2 percent (±1.3%)* above the revised February estimate of $845.5 billion. ... Spending on private construction was at a seasonally adjusted annual rate of $550.8 billion, 0.9 percent (±1.4%)* below the revised February estimate of $555.7 billion.
 Click on graph for larger image in new window.
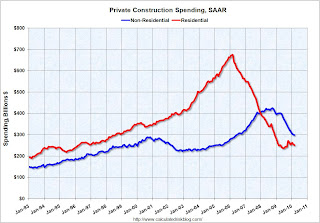
The first graph shows private residential and nonresidential construction spending since 1993. Note: nominal dollars, not inflation adjusted.
Private residential construction spending appears to have bottomed in early 2009, but has been mostly moving sideways since then. Residential spending is now 62.8% below the peak of early 2006.
Private non-residential construction spending continues to decline as major projects are completed. Non-residential spending is now 29.9% below the peak of late 2008.
 The second graph shows the year-over-year change for private residential and nonresidential construction spending.
Nonresidential spending is off 25.5% on a year-over-year (YoY) basis.
Residential construction spending is now up slightly from a year ago.
Private residential spending will probably exceed non-residential spending later this year - mostly because of continued declines in non-residential spending. Private consturction will be a weak sector for some time.


