 RSS Feed
 by Calculated Risk on 9/27/2007 10:21:00 PM
Thursday, September 27, 2007
First Data: $9.4 Billion Sold
From the WSJ: Bond Market Starts Showing Relief Signals
... Wall Street investment banks yesterday sold investors $9.4 billion in risky bank loans issued by First Data Corp. to finance its leveraged buyout.Selling loans for 96 cents on the dollar is considered good news in this environment. Maybe Credit Suisse and Citigroup can sell more, and make up the loss with volume!
It was the largest sale of leveraged loans since that of HCA Inc. last year. It was also nearly double the $5 billion in loans the banks said they were attempting to sell.
Still, the underwriters, which include Credit Suisse and Citigroup Inc., hold on their own books the bulk of the $24 billion in loan financing they provided for First Data.
The key number is the $14 billion or so in pier loans. The total deal value was $26 billion with $24 billion in debt. This is still larger than the Chrysler pier loans that were only $10 Billion.
Roubini: "Too Optimistic on Housing"
by Calculated Risk on 9/27/2007 03:03:00 PM
Professor Roubini write: I Was Way Too Optimistic on the Housing Recession...
In March of this year this author published a long paper (with Christian Menegatti) titled “The Housing Recession is Still Far from Bottoming Out” that predicted a much worsening housing recession through all of 2008. In that paper the prediction was that housing starts – that had already fallen by 38% by January of 2007 to a level of 1.4 million - would fall much further and would bottom out at 1.1 million in 2008. Indeed, by looking at previous housing recession – where the average fall in starts was 51% - it was sensible to be that pessimistic. Again those predictions were dismissed as too gloomy and pessimistic and unrealistic.To add to Roubini's comments, here is the current Goldman Sachs housing forecast (New Home sales falling to 650K units and starts falling to 1.1 million units).
But it turned out that I was way too optimistic about housing, not too pessimistic. As recently reported housing starts have now fallen by 42% and now JP Morgan – one of the most respected research houses on Wall Street and a persistent proponent until recently of the view that the housing recession would bottom out – is predicting that housing starts will fall another 25% to a cumulative fall of 56% from peak and will bottom out at 999 thousand units some time in 2008. Compared to my initial March prediction of a bottom at 1.1 million I turn out to be an optimist. And indeed many other research firms (including Goldman Sachs, Citibank and others) are now predicting the bottom of housing starts at 1 million to 1.1 million units. So what in March was considered as borderline lunatic is now becoming conventional wisdom.
...
Right now I see housing start falling more than the 1.1 million that Menegatti and I predicted in March as the housing market has deteriorated since then much more than our then dire predictions. Given the continued fall in building permits and in home sales and the massive excess supply of new and existing homes housing starts could bottom out at level close to previous housing recession, i.e. between 800k and 900k.
Since I predicted a fall in starts to 1.1 million units a couple of years ago, people are now asking if I was also "too optimistic". First, I don't measure my predictions to the WS forecasts, but to the actual numbers. Starts have fallen to 1.331 million units (SAAR) in the latest report, so it is still too early to count coup. Second, I wasn't trying to forecast the exact number, rather the general size of the down turn - IMO there is little difference between 1.1 million starts and, say, 1.0 or 1.2 million starts. The overall downturn is about the same.
However Roubini's new bottom forecast for starts (800K to 900K) is a significant downward revision from his previous forecast. I'll update my forecast at the end of the year (the housing market moves in slow motion, so there is no need to change forecasts frequently). Right now I think my number still looks about right.
Fannie Says Housing Slump to Last Beyond 2008
by Calculated Risk on 9/27/2007 02:46:00 PM
On Bloomberg Video: Mudd of Fannie Says Housing Slump to Last Beyond 2008.
Click image for video.

September 27 (Bloomberg) -- Fannie Mae Chief Executive Officer Daniel Mudd talks with Bloomberg's Peter Cook in Washington about the state of the U.S. housing market, the prospects for raising Fannie's mortgage portfolio cap and the outlook for legislation to create a new regulator for the government-sponsored enterprises. Mudd, whose government-chartered company is the largest provider of money for U.S. home loans, said the housing slump will last beyond next year. (Source: Bloomberg)
More on August New Home Sales
by Calculated Risk on 9/27/2007 11:03:00 AM
For more graphs, please see my earlier post: August New Home Sales Click on graph for larger image.
The first graph shows New Home Sales vs. Recession for the last 35 years. New Home sales were falling prior to every recession, with the exception of the business investment led recession of 2001. This should raise concerns about a possible consumer led recession - possibly starting right now!
The second graph compares annual New Home Sales vs. Not Seasonally Adjusted (NSA) New Home Sales through August.
Typically, for an average year, about 70% of all new home sales happen before the end of August. Therefore the scale on the right is set to 70% of the left scale.
It now looks like New Home sales will be in the low 800s - the lowest level since 1997 (805K in '97). My forecast was for 830 to 850 thousand units in 2007 and that might be a little too high.
A comment on revisions:
The Census Bureau revises the New Home sales number three times (plus annual revisions). During a housing down turn, most of the revisions from the Census Bureau are down. This is important to keep in mind when looking at a new monthly report. This chart shows the cumulative revisions for each month since sales activity peaked in July 2005 (annual revisions are not shown). The last time there was a positive cumulative revision (red column) was in September 2005.
The median change for the first revision is a decline of 1.6% (average decline of 1.8%) over the last two years.
The cumulative median change for the second revision is a decline of 3.6%.
The cumulative median change for the third revision is a decline of 4.8%. Since the last upward cumulative revision (Sept 2005), the range has been from a small decline of 0.2% in Dec '05, to a decline of almost 11% for May '06.
The new homes sales number today will probably be revised down too. Applying the median cumulative revision (4.8%) during this downtrend suggests a final revised Seasonally Adjusted Annual Rate (SAAR) sales number of 757 thousand for August (was reported as 795 thousand SAAR by the Census Bureau). Just something to remember when looking at the data.
August New Home Sales
by Calculated Risk on 9/27/2007 09:59:00 AM
According to the Census Bureau report, New Home Sales in August were at a seasonally adjusted annual rate of 795 thousand. Sales for July were revised down to 867 thousand, from 870 thousand. Numbers for May and June were also revised down. 
Click on Graph for larger image.
Sales of new one-family houses in August 2007 were at a seasonally adjusted annual rate of 795,000 ... This is 8.3 percent below the revised July rate of 867,000 and is 21.2 percent below the August 2006 estimate of 1,009,000.
The Not Seasonally Adjusted monthly rate was 68,000 New Homes sold. There were 88,000 New Homes sold in August 2006.
Aug '07 sales were the lowest August since 1995 (63,000).
The median and average sales prices were down sharply. Caution should be used when analyzing monthly price changes since prices are heavily revised and do not include builder incentives.
The median sales price of new houses sold in August 2007 was $225,700; the average sales price was $292,000.
The seasonally adjusted estimate of new houses for sale at the end of August was 529,000.
The 529,000 units of inventory is slightly below the levels of the last year.
Inventory numbers from the Census Bureau do not include cancellations - and cancellations are once again at record levels. Actual New Home inventories are probably much higher than reported - some estimate are about 20% higher.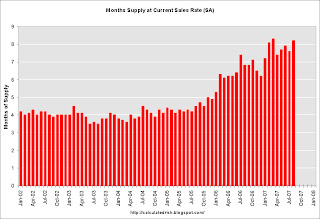
This represents a supply of 8.2 months at the current sales rate.
This is another very weak report for New Home sales. This is the first report after the start of the credit turmoil, and, as expected, the numbers are very ugly.
More later today on New Home Sales.


