 RSS Feed
 by Calculated Risk on 9/14/2007 09:01:00 AM
Friday, September 14, 2007
Northern Rock Bank Run
| UPDATE: From Paul in London. Northern Rock branch in Hounsditch, City of London 3.12pm today. |  |
 Photo from the Guardian, credit Sang Tan/AP.
From Bloomberg: Northern Rock Customers Crowd London Branches, Withdraw Money
Hundreds of Northern Rock Plc customers crowded into branches in London today to pull out their savings after the mortgage-loan provider sought emergency funding from the Bank of England ...
 2nd Photo from BBC.
The Bank of England said it will provide emergency cash to Northern Rock, Britain's third-largest mortgage provider, in the nation's biggest bailout of a financial institution in 30 years. The rising cost of credit left the lender unable to make new loans and stoked concern among customers about their money.It looks like the older customers stand in the queue; there is probably an online bank run too.
Thursday, September 13, 2007
Video of the Day
by Calculated Risk on 9/13/2007 09:02:00 PM
NOTE: The video of the day (or so) won't be a post - it will just be at the bottom of the page. It's just for fun when I feel like updating it. People frequently send me funny videos, but I don't want to make them posts, so this gives me an outlet to put them on the blog. CR
At the bottom of the posts, I've started posting a video of the day. I'll try to change it every day or so. I'm trying to pick videos that are funny or related to housing and /or the economy. Please don't read too much into the videos I pick - and please feel free to suggest other videos.
Here were the first few couple I picked.
| Professor Shiller speaks on housing at the Jackson Hole 2007 Symposium. | |
| Students at the Columbia Business School Spring 2006 Follies make fun of their Dean and Fed Chairman Ben Bernanke to the Police's "Every Breath You Take". | |
Professor Krugman on housing from Sept 2006. Here is a quote from Dr. Krugman, in a "Paul Krugman responds to reader's comments" on the impact of mortgage equity extraction: "Actually, a lot has been written on that, although mainly on blogs like calculatedrisk.blogspot.com, my go-to site on housing matters. So far the effect of the housing slump on consumer spending has been much less than I expected, although there are hints in the data that it's finally beginning to bite." |
Best to all.
BofE Bails out Northern Rock
by Calculated Risk on 9/13/2007 08:26:00 PM
From AFP: Bank of England to bail out British lender: reports (hat tip Brian jb Carlomagno sk)
According to the BBC and the Financial Times newspaper, Britain's fifth-biggest mortgage lender has struggled with lending since a credit market squeeze over the summer after concern sparked by uncertainty in the US subprime mortgage sector.The article notes the letter BoE Governor Mervyn King sent yesterday:
They said that the Bank of England (BoE), Britain's central bank, had agreed to provide short-term lending to Northern Rock to help it see out the crisis in what the FT described as the most dramatic development in the UK banking market since the crisis began.
...
John McFall, chairman of the parliamentary committee that oversees financial issues, urged the lender's customers to stay calm.
He said Northern Rock's request for funding should be seen as "reassuring, because it means they think the problems are temporary."
In a letter to McFall's committee on Wednesday, BoE Governor Mervyn King warned that providing short-term liquidity to the financial markets while they were experiencing trouble served to encourage "excessive risk-taking and sows the seeds of a future financial crisis".So much for tough talk.
"The provision of large liquidity facilities penalises those financial institutions that sat out the dance, encourages herd behaviour and increases the intensity of future crises."
Housing Starts and Demographics
by Calculated Risk on 9/13/2007 06:48:00 PM
Both the UCLA Anderson Forecast and Goldman Sachs have recently revised down their estimates for housing starts for the next couple of years. UCLA is now forecasting starts falling to 1 million units annually. Goldman Sachs' forecast is for starts to fall to 1.1 million units in Q4 '07 and Q1 '08 (see bottom of this post for Goldman's housing forecast by quarter).
My forecast is for starts to fall to about 1.1 million units.
Two Key Points:
1. If these forecasts are accurate, starts have fallen less than 60% from the recent peak annual rate in 2005 (2.07 million units) to the eventual bottom. We are barely more than half way, in terms of starts, from the peak to the trough!
2. Demographics are NOT currently favorable for housing as compared to the late '60 through early '80s.
Here is a graph of housing starts since 1959 at a Seasonally Adjusted Annual Rate (SAAR) (Source: Census Bureau). Note: Remember starts include homes built for sales, owner built homes, apartments and condominiums. These number can't be compared directly to New Home sales. Click on graph for larger image.
This graph shows that starts have fallen from just over 2 million units per year to an average of 1.45 million (SAAR) over the first 7 months of 2007. Based on the above forecasts there is a second significant decline in starts coming.
Look at those peaks in starts in the '70s and early '80s. This has led some analysts to argue that the recent peak in activity wasn't extraordinary, especially since the U.S. population is growing. This is an inaccurate view. The second graph shows the trend of people per household (and people per total housing units) in the United States since 1950. Before the period shown on this graph there was a long steady down trend in the number of people per household.
Note: the dashed lines indicates estimates based on the decennial Census for 1950 and 1960.
Starting in the late '60s there was a rapid decrease in the number of persons per household until about the late '80. This was primarily due to the "baby boom" generation forming new households en masse.
It was during this period - of rapid decline in persons per household - that the peaks in housing starts occurred. Many of those starts, especially in the '70s, were for apartments. Even if there had been no increase in the U.S. population, the U.S. would have needed approximately 27% more housing units at the end of this period just to accommodate the change in demographics (persons per household).
Now look at the period since 1988, the persons per household has remained flat. The increase in 2002 was due to revisions, and isn't an actual shift in demographics. If the population had remained steady since 1988, the U.S. wouldn't have needed any additional housing units!
Here is a simple formula for housing starts (assuming no excess inventory):
Housing Starts = f(population growth) + f(change in household size) + demolitions.
f(change in household size) was an important component of housing demand in the '70s and early '80s. In recent years, f(change in household size) = zero.
Now for a little good news for housing: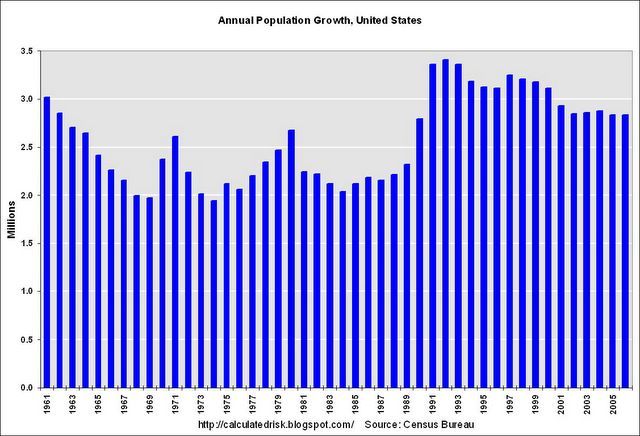
This chart show the annual U.S. population growth according to the Census Bureau. The surge in the early '90s was probably a combination of the Baby Boom echo and perhaps immigration. But the key is that population growth is currently running about 2.85 million people per year.
Back to the formula, this means f(population growth) is larger now than in the '70 and '80s. Unfortunately the improvement in this term is dwarfed by the decline in f(change in household size).
Another piece of good news for housing is that the housing inventory is aging, meaning that the need for demolitions is steadily increasing.
As I noted above, this analysis excludes excess inventory, and unfortunately the current excess is significant (I'll return to this point).
The two key points: there is a second significant decline in starts ahead of us, and demographics are not currently favorable for housing (compared to the '70 and early '80s).
Bay Area home sales slowest since 1992
by Calculated Risk on 9/13/2007 03:01:00 PM
From DataQuick: Bay Area home sales slowest since early 1990s, flat prices
Bay Area homes sold at the slowest pace in 15 years last month as market uncertainty intensified, forcing more buyers, sellers and lenders to the sidelines. Prices remained flat at the regional level but there were local variations, a real estate information service reported.And on prices:
A total of 7,299 new and resale houses and condos were sold in the nine-county Bay Area in August. That was down 1.7 percent from 7,423 in July, and down 24.9 percent from 9,713 for August a year ago, according to DataQuick Information Systems.
Sales have decreased on a year-over-year basis the last 31 months. Sales last month were the lowest for any August since 1992 when 6,688 homes were sold. The strongest August in DataQuick's statistics, which go back to 1988, was in 2004 when 13,940 homes were sold. The August average is 10,170.
"Homes in the Bay Area are more expensive than elsewhere and most of them are financed with 'jumbo' mortgages. The turbulence in the mortgage markets has made it more difficult to get this type of financing. The question is: does this pull the plug on some market activity, or does it just slow things down? We won't know the answer for a few months," said Marshall Prentice, DataQuick president.On foreclosures:
The median price paid for a Bay Area home was $655,000 last month. That was down 1.5 percent from the June and July peak of $665,000, and up 4.0 percent from $630,000 for August a year ago.
Foreclosure resales accounted for 4.8 percent of August's sales activity, up from 4.5 percent in July, and up from 1.2 percent in August of last year. Foreclosure resales do not yet have a regional effect on prices.These numbers are for both new and existing homes. For existing homes, sales that closed in August were actually signed in June or July - before the credit market turmoil. That is why we have to wait a couple of months to know the answer to DataQuick's question: "The question is: does this pull the plug on some market activity, or does it just slow things down?"


