 RSS Feed
 by Calculated Risk on 1/25/2007 03:55:00 PM
Thursday, January 25, 2007
Existing Home Sales as Percent of Owner Occupied Units
First, a couple of quotes from the NAR press release today:
“It looks like we’re moving beyond the low for the housing cycle last fall ..."
David Lereah, NAR’s chief economist, Jan 25, 2007
"... we’re looking for slow, steady gains in both home sales and prices through 2008.”Last month economist David Berson at Fannie Mae projected existing home sales would fall to 5.925 million units in '07 (NAR reported 2006 sales at 6.48 million units today). Will sales rise in '07 as forecast by the NAR spokesmen, or will sales fall as projected by Fannie Mae economists and others?
NAR President Pat Vredevoogd Combs, Jan 25, 2007
 One of the rarely told stories of the housing boom was the jump in turnover of existing homes. This graph shows sales normalized by the number of owner occupied units. This shows the extraordinary level of sales for the last few years, reaching 9.5% of owner occupied units in 2005. The median level is 6.0% for the last 35 years.
Some of the sales were for investment and second homes, but normalizing by owner occupied units probably provides a good estimate of normal turnover. If sales fall back to 6% that would about 4.6 million units. If sales fall back to the level of 1998 to 2001 (7.3% of total owner occupied units sold) that would be about 5.6 million units in 2007.
My guess is existing home sales will "surprise" to the downside, perhaps in the 5.6 to 5.8 million unit range, or approximately 7.5% of owner occupied units.
Note: from my Housing in 2007 predictions.
Unemployment Insurance Weekly Claims
by Calculated Risk on 1/25/2007 10:51:00 AM
Here is a bad headline from the AP: Jobless claims rise to 16-month high.
The U.S. Department of Labor reported:
In the week ending Jan. 20, the advance figure for seasonally adjusted initial claims was 325,000, an increase of 36,000 from the previous week's revised figure of 289,000. The 4-week moving average was 309,250, an increase of 1,500 from the previous week's revised average of 307,750.Just 4 weeks ago claims were also 325,000, and in the last week of November, claims were 358,000. So why is this a "rise to a 16-month high"?
The AP is referring to the increase in claims from last week.
The Labor Department reported Thursday that 325,000 newly laid-off workers filed claims for jobless benefits last week, an increase of 36,000 from the previous week. That was the biggest one-week rise since a surge of 96,000 claims the week of Sept. 10, 2005, when devastated Gulf Coast businesses laid off workers following Hurricane Katrina.Why does anyone care? Weekly claims are notoriously noisy week to week, so everyone follows the 4-week moving average.
 Click on graph for larger image.
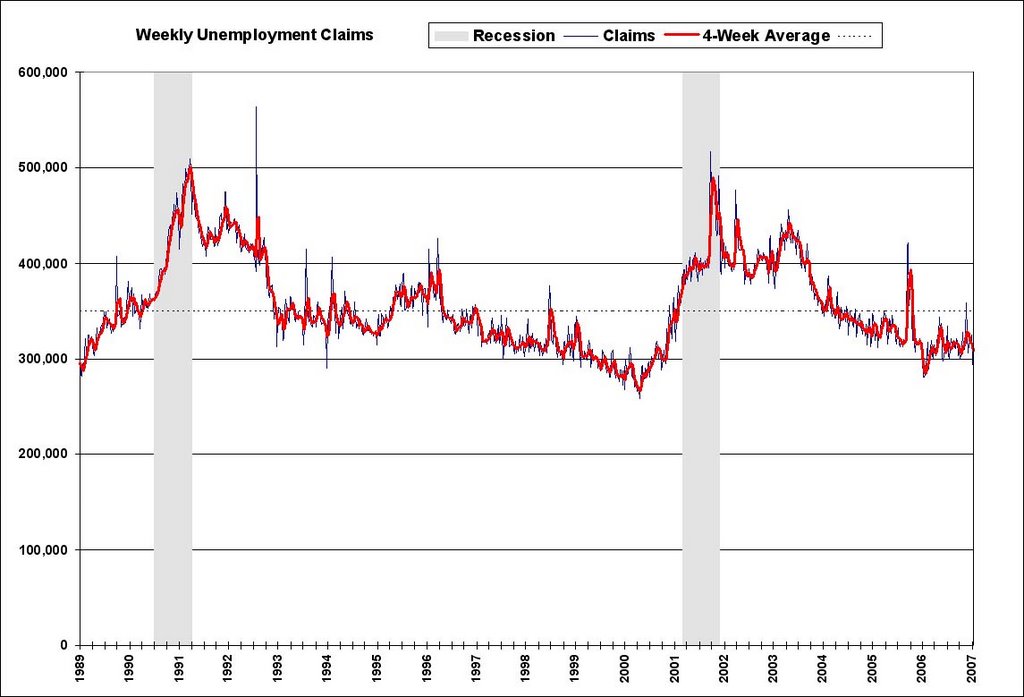
This graph shows the weekly unemployment claims and the 4-week moving average vs. recessions since 1989. The dashed line at 350,000 is the level of concern for the 4-week moving average.
Currently the 4-week average is 309,250; not a concern.
December Existing-Home Sales Ease
by Calculated Risk on 1/25/2007 10:13:00 AM
The National Association of Realtors (NAR) reports: Existing-Home Sales Ease Click on graph for larger image.
Total existing-home sales – including single-family, townhomes, condominiums and co-ops – eased 0.8 percent to a seasonally adjusted annual rate1 of 6.22 million units in December from a level of 6.27 million in November. Sales were 7.9 percent lower than a 6.75 million-unit pace in December 2005.The above graph shows NSA monthly sales for 2005 and 2006. On an NSA basis, sales were 11% below December 2005.

Total housing inventory levels fell 7.9 percent at the end of December to 3.51 million existing homes available for sale, which represents a 6.8-month supply at the current sales pace – down from a 7.3-month supply in November.
 Inventory is not seasonally adjusted, and it is normal to see a decline in inventory in December during the holidays. Usually 6 to 8 months of inventory starts causing pricing problems, and over 8 months a significant problem. With current inventory levels at 6.8 months of supply, inventories are now well into the danger zone.
There were 6,480,000 existing-home sales in all of 2006, down 8.4 percent from a record 7,075,000 in 2005. The second highest total was 6,779,000 in 2004; NAR began tracking home sales in 1968.

2006 was the third highest sales year ever, and 2006 also had record year end inventories, both in actual numbers and as a percent of owner occupied units.
This graph shows the annual sales, since 1969, and year end inventory numbers since 1982.
Wednesday, January 24, 2007
Economic Experts are Optimistic
by Calculated Risk on 1/24/2007 08:02:00 PM
"You were talking about the ugly bears. The reality is that we see a lot of ugly bears growing horns and becoming bulls."From AP on the World Economic Forum in Davos, Switzerland: Experts Ponder Impact of U.S. Slowdown
Jacob Frenkel, vice chairman of insurer AIG, to Nouriel Roubini, Jan 24, 2007
The majority of panel members at the major economic session on the opening day of the World Economic Forum's annual meeting predicted a soft landing ...For the lone bear at Davos' views, see Roubini's First Day in Davos: 2007 Global Economic Outlook
Laura Tyson, a professor at the University of California at Berkeley who was Clinton's top economic adviser, agreed, saying "there are some reasons to be very optimistic for the coming year."
Looking at projections for 2007, she said, there is "an amazing similarity of predicted growth rates for the U.S., Europe and Japan, between 2 and 2 1/4 percent _ a result of the European and Japanese economies picking up and the slowdown in the United States."
Financial markets are not as volatile as they were because of a long-run positive trend in output and interest rates, she said.
Tyson added that the global economy has diversified to the point that it no longer is "dependent on a single locomotive, the United States."
Emerging markets have also been growing and expanding to account for more than half of the world economy, she said.
"All of those things to my mind suggest another Goldilocks year," Tyson said, adding that "it'll look different from the last Goldilocks year."
I was the only one who expressed some concerns about a US hard landing that could take the form of a growth recession or an outright recession ...Roubini suggests:
The consensus, clear at the panel, was for another Goldilocks year for the US and global economy with the US achieving a soft landing.
... housing is only 6% of GDP while consumption is 70% ... So any hard landing – whether a growth recession or an outright recession – will require a sharp slowdown of consumption growth. I do believe that the next leg of the US slowdown, that will lead at least to a growth recession, will be the consumer weakened by a variety of factors:One more comment from Frankel:- The job losses in housing and manufacturing will build up over 2007 and reduce job growth from 150k jobs to about 50k jobs per month over the next few months. So, labor slack will reduce income generation.So, while the US consumer will be the last shoe to drop it will drop this year as the consumer is at its tipping point in spite of the recent temporary factors that have boosted its consumption. So I do not believe that the economy will achieve the soft landing predicted by the economic consensus as the balance of risks and vulnerabilities suggests further economic weakness ahead.
- The negative wealth effects of falling housing values and falling mortgage equity withdrawal will slow down consumption as households with negative savings have been using their homes as their ATM machine for too long.
- Rising reset interest rates on monster mortgages, ARMs and subprime loans will increase debt servicing ratios.
- The coming credit crunch in the subprime sector will serious hurt subprime and other ARM borrowers.
"I'm optimistic but not sanguine."Say what? I think the AP writer missed something.


