 RSS Feed
 by Calculated Risk on 3/05/2006 02:05:00 PM
Sunday, March 05, 2006
Home Economics: A Profile of Edward L. Glaeser
The NY Times Magazine has an excellent article on economist Dr. Edward L. Glaeser: Home Economics. (hat tip to Dr. Thoma).
On the impact of the durability of housing:
... when cities grow, they expand significantly in population, but housing prices tend to rise slowly; even as Las Vegas grew by leaps and bounds in the 1990's, for instance, the average home there cost well under $200,000. When cities decline, however, the trends get flipped around. Population diminishes slowly, but housing prices tend to drop markedly.Although Dr. Glaeser believes restrictive regulations have played an important role in surging house prices, he also thinks there has been a psychological component:
Glaeser and Gyourko determined that the durable nature of housing itself explains this phenomenon. People can flee, but houses can take a century or more to finally fall to pieces. "These places still exist," Glaeser says of Detroit and St. Louis, "because the housing is permanent. And if you want to understand why they're poor, it's actually also in part because the housing is permanent." For Glaeser, this is the story not only of these two places but also of Buffalo, Baltimore, Cleveland, Philadelphia and Pittsburgh — the powerhouse cities of America in 1950 that consistently and inexorably lost population over the next 50 years. It is not just that there were poor people and the jobs left and the poor people were stuck there. "Thousands of poor come to Detroit each year and live in places that are cheaper than any other place to live in part because they've got durable housing still around," Glaeser says. The net population of Detroit usually decreases each year, in other words, but the city still attracts plenty of people drawn by its extreme affordability. As Gyourko points out, in the year 2000 the median house price in Philadelphia was $59,700; in Detroit, it was $63,600. Those prices are well below the actual construction costs of the homes. "To build them new, it would cost at least $80,000," Gyourko says, "so there's no builder who would build those today. And as long as those houses remain, the people remain."
Glaeser ... says, "I'm comfortable with the notion that we're going to have a substantial correction over the next five years."
Friday, March 03, 2006
Rising Rates
by Calculated Risk on 3/03/2006 02:26:00 PM
The yield on the Ten Year note has risen to 4.68%. This is about the same level as the second quarter of 2002.
Click on graph for larger image.
For the Ten Year, I plotted today's yield as Q2 2006. This shows yields on the Ten Year are close to Q2 2002 and probably means mortgage rates will rise next week close to Q2 2002 levels.
It will be interesting to see if the MBA purchase index shows another decline in activity.
Thursday, March 02, 2006
Fiscal 2006: Record YTD Increase in National Debt
by Calculated Risk on 3/02/2006 02:15:00 AM
After five months, Fiscal 2006 continues to set new records for the YTD increase in National Debt. For the first five months of fiscal year 2006, the National Debt increased $337.2 Billion to $8.27 Trillion as of Feb 28, 2006. 
Click on graph for larger image.
The previous record for the first five months was in fiscal 2005 with an increase in the National Debt of $334.1 Billion.
Currently Treasury Secretary Snow is struggling to keep the debt under the "debt ceiling". The Charlston Gazette editorialized:
TREASURY Secretary John Snow says Congress must raise the federal debt limit to nearly $9 trillion by mid-March or the U.S. government will default on its obligations. This will be the fourth large hike in the debt ceiling in five years.Each month I will plot the YTD increase in the National Debt and compare it to the proceeding years. I expect fiscal 2006 to set a new record for the annual increase in the National Debt.
Washington Republicans are in a sweat, because the impending vote may spotlight outrageous overspending that has occurred under President Bush, who insists on gigantic tax giveaways to the rich amid gigantic military spending.
As we’ve noted before, the federal debt was only $1 trillion under Democratic President Jimmy Carter — but it quadrupled during the Republican Reagan-Bush years — then the U.S. budget was balanced again under Democratic President Bill Clinton.
During the 1990s, Congress followed pay-as-you-go rules, banning new spending that lacked revenue to pay for it. This discipline slowly wiped out yearly deficits. But the businesslike policy was abandoned under Bush, to allow more militarism and more tax cuts for the affluent.
To avoid the embarrassment of voting for higher debt limits, House GOP leaders adopted a sneaky rule that lets the ceiling climb automatically, without a House vote. But the Senate must vote for the $9 trillion level. Some national observers expect Senate GOP leaders to stifle debate in an attempt to accomplish the action quietly.
We hope West Virginia’s senators draw public notice to this new plunge into the hole. Americans need to know that the current one-party rule in Washington lives on credit cards — and today’s children will be stuck with the tab.
Wednesday, March 01, 2006
MBA: Mortgage Purchase Applications Steady
by Calculated Risk on 3/01/2006 10:31:00 AM
The Mortgage Bankers Association (MBA) reports that mortgage applications decreased slightly for the week ending Feb 24th. 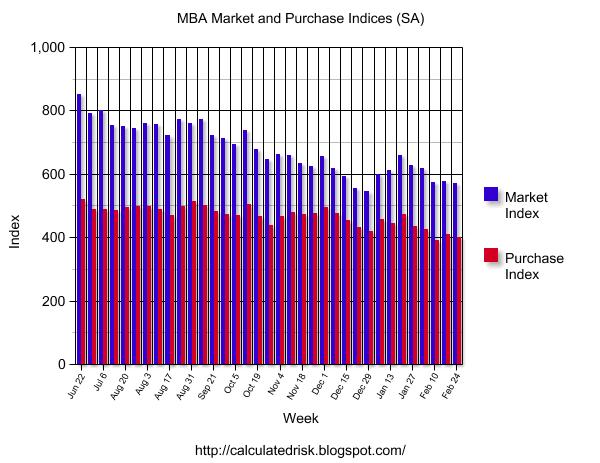
Click on graph for larger image.
The Market Composite Index — a measure of mortgage loan application volume was 571.5 – a decrease of 1.2 percent on a seasonally adjusted basis from 578.5 one week earlier. On an unadjusted basis, the Index decreased 9.6 percent compared with the previous week and was down 18.9 percent compared with the same week one year earlier. There was an adjustment included in the seasonally adjusted indexes to account for the President’s Day holiday.Mortgage rates declined slightly:
The seasonally-adjusted Purchase Index decreased by 1.9 percent to 400.8 from 408.7 the previous week, whereas the Refinance Index increased by 0.1 percent to 1573.5 from 1571.4 one week earlier.
The average contract interest rate for 30-year fixed-rate mortgages decreased to 6.18 percent from 6.22 percent ...Activity is still fairly high though off from the peaks of 2005.
The average contract interest rate for 15-year fixed-rate mortgages decreased to 5.84 percent from 5.87 percent ...
OFHEO: House Price Appreciation Continues at Robust Pace
by Calculated Risk on 3/01/2006 10:00:00 AM
The Office of Federal Housing Enterprise Oversight (OFHEO) released the Q4 2005 House Price Index.
HOUSE PRICE APPRECIATION CONTINUES AT ROBUST PACEUPDATE: From a bubble perspective, three of the most closely watched cities have been Boston, Sacramento and San Diego - all three have shown signs of a housing slowdown.
OFHEO House Price Index Shows Annual Rise of Nearly 13 Percent;
Unprecedented Increases in 26 Metropolitan Areas
WASHINGTON, D.C. – Average U.S. home prices increased 12.95 percent from the fourth quarter of 2004 through the fourth quarter of 2005. Appreciation for the most recent quarter was 2.86 percent, or an annualized rate of 11.4 percent. The increase during 2005 is similar to the revised increase of 12.55 percent for the year ended with the third quarter of 2005, showing no evidence of a slowdown. The figures were released today by OFHEO Acting Director Stephen A. Blumenthal, as part of the House Price Index (HPI), a quarterly report analyzing housing price appreciation trends.
"Despite recent indications that a slowdown may be forthcoming, house price appreciation during 2005 continued to hover at near-record levels," said OFHEO Chief Economist Patrick Lawler.
House prices continued to grow considerably faster over the past year than did prices of non-housing goods and services reflected in the Consumer Price Index. House prices rose 12.95 percent, while prices of other goods and services rose only 4.3 percent.
"While deceleration continues in some areas, appreciation generally is still extremely strong," said Lawler. "Mortgage rates climbed significantly during the second half of last year, but the effect of that increase on price appreciation so far appears to be limited."
This HPI report ranks 10 additional Metropolitan Statistical Areas (MSAs) due to an increase in the number of mortgage transactions in those areas.
Significant findings in the HPI:
1. Four-quarter appreciation rates were at record levels in 26 metropolitan areas including Orlando-Kissimmee, FL; El Paso, TX; and Myrtle Beach-
Conway-North Myrtle Beach, SC.
2. Phoenix-Mesa-Scottsdale, AZ continues to be the MSA with the greatest appreciation rate of 39.7 percent.
3. Appreciation in Arizona continues to surpass price growth in other parts of the country by a wide margin. Appreciation was 34.9 percent between the fourth quarter of 2004 and the fourth quarter of 2005. This is more than eight percentage points greater than the rate in Florida, the second fastestappreciating state.
4. The Mountain Census Division became the fastest appreciating area of the country, edging out the Pacific Census Division. The area with the slowest price growth continues to be the East North Central Division, which includes Michigan, Wisconsin, Illinois, Indiana and Ohio.
5. Price growth in the South Atlantic Census Division which includes East Coast states from Maryland to Florida, was at its highest rate since 1975, the beginning of the period covered in OFHEO’s House Price Index. Home prices grew by 17.81 percent between the fourth quarter of 2004 and the fourth quarter of 2005.
6. For the first time since the third quarter of 2003, one of the MSAs included in OFHEO’s appreciation-rate ranking experienced a four-quarter price decline. Prices in Burlington, NC fell by approximately one percent between the fourth quarter of 2004 and the fourth quarter of 2005.
Boston prices increased 1.5% in Q4 2005 and 7.3% for 2005.
Sacramento prices increased 2.7% for the quarter, and 18.7% for the year.
San Diego prices increased 2.2% for the quarter, and 11% for the year.
Any housing slowdown for these areas is not evident in the Q4 House Price Index.


