 RSS Feed
 by Calculated Risk on 11/08/2005 06:31:00 PM
Tuesday, November 08, 2005
Housing and the Economy
Here are some interesting comments today on the impact of a housing slowdown on the economy:
Marketwatch: Bell 'Toll-ing' for housing market?
Toll Bros. warning fuels worries bubble set to finally pop
"If housing prices do not go up as much and interest rates are rising at the same time, fewer people will be able to take equity out of their homes," said Simon at Pimco.Reuters: U.S. stocks fall on concern about housing slowdown
"People are not only going to feel a lot less rich but they are going to have less money to spend," he added. "That can definitely hurt GDP."
"A soft real-estate market is not good for the consumer. It is not going to bode well going forward," said Weston Boone, vice president of listed trading at Legg Mason Wood Walker. "You have to take into consideration the rising interest-rate environment. There aren't a lot of catalysts for positive sentiment in the market."Investors Squeamish on Housing Outlook
"It would be a bit ominous for the economy if we see a dramatic slowdown in the housing sector," said Michael Metz, chief investment strategist at Oppeheimer & Co.What comes next? A slowdown in retail spending or real estate related job losses?
"The whole economy has been built on the wealth impact of the housing sector," Metz said.
Toll Brothers Warns
by Calculated Risk on 11/08/2005 10:53:00 AM
AP reports: Toll Brothers Cuts 2006 Home Deliveries View; Sees Weakened Demand in Some Markets
Toll Brothers Inc. cut its home deliveries forecast for fiscal 2006 on Tuesday, citing fewer than expected selling communities and weakened demand in several markets. Shares of the luxury home builder tumbled more than 11 percent in morning trading.
Toll Brothers projected home deliveries between 9,500 and 10,200 homes in fiscal year 2006, down from an earlier target of 10,200 to 10,600 homes. In fiscal 2005 it reported 8,769 deliveries.
"The shortage of selling communities, coupled with some softening of demand in a number of markets, negatively impacted our contract results," Toll Brothers said. "It appears we may be entering a period of more moderate home price increases, more typical of the past decade than the past two years."
Monday, November 07, 2005
Leaving California
by Calculated Risk on 11/07/2005 12:58:00 AM
My most recent post is up on Angry Bear: Will Boston Lead the Housing Bust?
Also, one of my friends is leaving California to take a job in Indiana. He currently lives in the Inland Empire and had a choice of living in Orange County or Indiana. The price of housing was the determining factor.
Apparently this is becoming more common - from the NY Times: Saying Goodbye California Sun, Hello Midwest
A growing number of people are leaving California after a decade of soaring home prices, according to separate data from the Census Bureau, the Internal Revenue Service and the state's finance department.
Last year, a half million people left California for other parts of the United States, while fewer than 400,000 Americans moved there. The net outflow has risen fivefold, to more than 100,000, since 2001, an analysis by Economy.com, a research company, shows, although immigration from other countries and births have kept the state's population growing.
The number of people leaving Boston, New York and Washington is also rising, and skyrocketing house prices appear to be a major reason, said Mark Zandi, chief economist at Economy.com. From New York, the net migration to Philadelphia more than doubled between 2001 and 2004, with 11,500 more people leaving New York for Philadelphia last year than vice versa. The number of New Yorkers who have moved to Albany, Charlotte, N.C., and Allentown, Pa., among other places, has also increased sharply.
Friday, November 04, 2005
Interest on the National Debt
by Calculated Risk on 11/04/2005 05:49:00 PM
The average weighted interest rate on the National Debt will most likely rise in fiscal 2006. For fiscal 2005 (ended Sept 30th), the average interest rate was 4.6%. The rate rose to 4.74% in October.
Click on graph for larger image.
With continued heavy borrowing, a significant amount of debt due to rollover in early 2006, and rising interest rates, the weighted average rate will probably rise to 5% or more for fiscal 2006.
NOTE: 2006 is estimated at 5%.
The implications for the budget deficit are serious. The National Debt has increased substantially in recent years, while interest rates have been falling. This has kept the debt service payments in the low to mid $300 Billion range.
Now that interest rates are rising, the additional interest payments will add significantly to the General Fund deficit. A small increase to 5% of the weighted average interest rate will add $59 Billion to the fiscal 2006 General Fund deficit compared to fiscal 2005 debt service.
NOTE: Graph shows an estimated fiscal 2006 interest payment of $411 Billion.
Debt service is part of the reason I believe the National Debt will increase by a record $650 Billion in fiscal 2006. The US set an October record debt increase of $94.4 Billion - well on the way to an annual record.
October Jobs Report
by Calculated Risk on 11/04/2005 11:24:00 AM
The BLS released the Emploment Situation Summary this morning.
On Housing: Kash has some interesting comments on construction employment at Angry Bear: Disappointing Job Growth Here are some stats for October: Total jobs added: 56K.
1.8K .... Residential building
20.0K .. Residential specialty trade contractors
5.4K ... Depository credit intermediation (includes mortgage brokers)
3.3K ... Real estate
Total RE related = 30.5K
Previous economic releases have shown that construction spending and new home starts are still rising. This employment report is further confirmation that the building boom is continuing, even though the housing market appears to be slowing.
On overall employment: Bush's first term, with a net loss of 759K private sector jobs (a gain of 119K total jobs), was a disappointment. For Bush's 2nd term, anything less than 6.8 Million net jobs will have to be considered poor. And anything above 10 million net jobs as excellent. Of course, in additional to the number of jobs, the quality of the jobs and real wage increases are also important measures.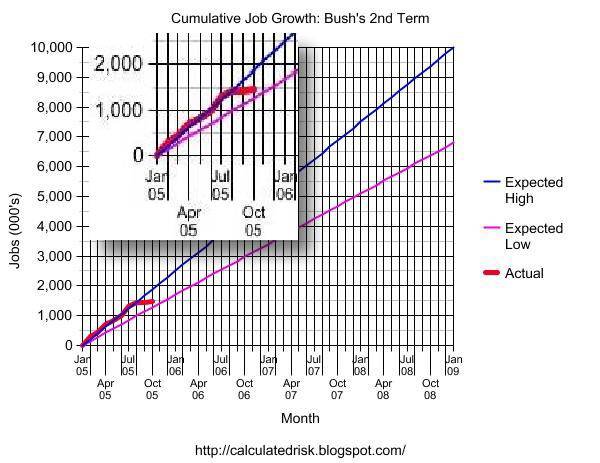
Click on graph for larger image.
For the quantity of jobs, this graph provides a measurement tool for job growth during Bush's 2nd term.
The blue line is for 10 million jobs created during Bush's 2nd term; the purple line for 6.8 million jobs.
The insert shows net job creation for the first 9 months of the 2nd term - the last three months have moved job creation towards the lower end of the acceptable range.


