 RSS Feed
 by Calculated Risk on 10/07/2005 10:06:00 AM
Friday, October 07, 2005
September Jobs Report
The jobs report can be summarized: Construction hot, manufacturing not, Katrina impact unclear. As is usual, construction added jobs while the downward trend in manufacturing continued. In fact, manufacturing jobs (14.234 million) are at the lowest level since 1950.
UPDATE: Please see Dr. Altig's comments too. He points out that I was "incomplete" and writes that "outside of retail sales" and manufacturing "advances in employment were broad-based." See his graphs.
From the BLS:
Nonfarm payroll employment was little changed (-35,000) in September, and the unemployment rate rose to 5.1 percent ... The measures of employment and unemployment reported in this news release reflect both the impact of Hurricane Katrina, which struck the Gulf Coast in late August, and ongoing labor market trends.Did this report, with "negligible" impact from Katrina, accurately measure the employment impact of Katrina? The BLS is not sure:
For the September CES estimates, several modifications to the usual estimation procedures were adopted to better reflect employment in Katrina-affected areas. The changes included: a) modification of procedures to impute employment counts for survey nonrespondents in the most heavily impacted areas b) adjustments to sample weights for sample units in the more broadly defined disaster area to compensate for lower-than-average survey response rates, and c) modification of the adjustment procedure for the business net birth/death estimator to reflect likely changes in business birth/death patterns in the disaster areas.It will probably takes several months to accurate assess the impact of Katrina on jobs. Meanwhile, the relatively strong report (-150K jobs was the expectation) has led to a sell off in bonds with the 10 year yield above 4.4% (but bonds are rallying as I type).
Hurricane Rita made landfall during the September data collection period. As a result, response rates for both surveys were lower than normal in some areas. However, because the reference periods for both surveys occurred before Hurricane Rita struck, the impact of this storm on measures of employment and unemployment was negligible.
On overall employment: Bush's first term, with a net loss of 759K private sector jobs (a gain of 119K total jobs), was a disappointment. For Bush's 2nd term, anything less than 6.8 Million net jobs will have to be considered poor. And anything above 10 million net jobs as excellent. Of course, in additional to the number of jobs, the quality of the jobs and real wage increases are also important measures.
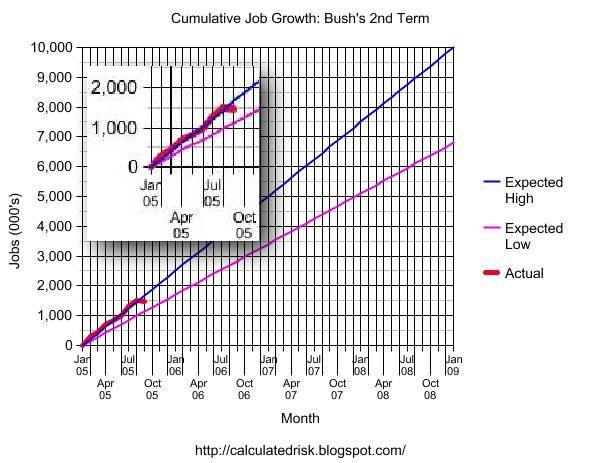
Click on graph for larger image.
For the quantity of jobs, this graph provides a measurement tool for job growth during Bush's 2nd term.
The blue line is for 10 million jobs created during Bush's 2nd term; the purple line for 6.8 million jobs. The insert shows net job creation for the first 8 months of the 2nd term - currently midway between the two lines.
Thursday, October 06, 2005
California Realtors: Affordability At Record Low
by Calculated Risk on 10/06/2005 08:24:00 PM
The California Association of Realtors reports: Housing Affordability Index fell four points to 14 percent in August; lowest on record since 1989
The percentage of households in California able to afford a median-priced home stood at 14 percent in August, a 4 percentage-point decrease compared with the same period a year ago when the Index was at 18 percent, according to a report released today by the California Association of REALTORS® (C.A.R.). The August Housing Affordability Index (HAI) declined 2 percentage points compared with July, when it stood at 16 percent.
C.A.R.’s monthly housing affordability index measures the percentage of households that can afford to purchase a median-priced home in California. C.A.R. also reports housing affordability indexes for regions and select counties within the state. The Index is the most fundamental measure of housing well-being in the state.
The minimum household income needed to purchase a median-priced home at $568,890 in California in August was $133,800, based on an average effective mortgage interest rate of 5.87 percent and assuming a 20 percent downpayment. The minimum household income needed to purchase a median-priced home was up from $110,980 in August 2004, when the median price of a home was $473,520 and the prevailing interest rate was 5.83 percent.
The minimum household income needed to purchase a median-priced home at $220,000 in the U.S. in August 2005 was $51,740.
Realtor Economist: 'Bubble Talk Overblown'
by Calculated Risk on 10/06/2005 12:33:00 PM
The Contra Costa Times reports:
The long-booming housing market is moderating, but fears of a bubble are overblown, according to the chief economist for the California Association of Realtors.Prices will increase a modest 6% to 12%? I think most homebuyers would be very happy with that "modest" return. The article also mentions the UCLA Anderson Forecast and Dr. Thronberg:
In a presentation in San Ramon before the Contra Costa Association of Realtors on Wednesday, Leslie Appleton-Young predicted that 2005 will represent the peak of the housing market, with state home sales likely to fall 2 percent next year.
Median home prices, however, will continue to rise, if at a slower pace. The CAR expects prices to increase 10 percent in California in 2006, compared with the estimated 16 percent increase this year. In the Bay Area, housing prices are likely to climb a more modest 6 percent to 12 percent.
"The forecast for California is mediocre at best, and at worst we are liable to slip into a recession," wrote study author Chris Thornberg. He said California homes are overvalued by as much as 40 percent to 45 percent.
Wednesday, October 05, 2005
US energy chief: High fuel prices to persist
by Calculated Risk on 10/05/2005 06:50:00 PM
The Financial Times reports: High fuel prices to persist says US energy chief:
Higher energy costs triggered by Hurricanes Katrina and Rita could persist for several years, leaving reduced consumption as the only short-term relief, Samuel Bodman, the US energy secretary, warned on Wednesday.The problem is twofold: In the short run there is a lack of refining capacity because 12 refineries are still shut down in the Gulf Coast area, and in the intermediate run, there is significant damage to oil producing facilities in the Gulf of Mexico. From the Energy Information Administration on refineries:
"Both oil and natural gas availability has been severely impaired and the effects of this will reverberate through the economy of this country for some time," he told a breakfast meeting of reporters. "The main thing that US citizens can do is conserve. We simply have to do it." He predicted conservation efforts would make "a major dent" in demand.
"...there are 4 refineries still shut down in the New Orleans area following Hurricane Katrina, 7 shut down in the Port Arthur and Lake Charles areas, and 1 shut down or attempting to restart in the Houston/Texas City/Galveston refining area, amounting to a total of over 3.0 million barrels per day of refining capacity that is currently offline. This accounts for over 1.3 million barrels per day of gasoline, over 700,000 barrels per day of distillate fuel, and nearly 400,000 barrels per day of jet fuel that is not being produced as long as these refineries remain shutdown."

Click on graph for larger image.
In the short run, the supply of gasoline and other refined products is critically important. The graph from the DOE shows that gasoline stocks are near the bottom of the normal range and falling. This despite record imports of refined products, as reported in the Financial Times:
US petrol imports last week hit a record 1.4m barrels a day, the Energy Information Administration said on Wednesday.Once again the financial media is confused on the oil and gasoline supply and demand dynamics. The AP is reporting:
"The price of oil fell to its lowest level in two months on Wednesday as evidence builds that the high cost of gasoline and other fuels is sapping demand."The AP report is incorrect. The price of oil is falling because the demand for oil is falling. The demand for oil is falling because the 12 refineries are shut down.
 This graph compares the 2004 and 2005 demand for gasoline for each week from the beginning of June. For 2005, the demand for gasoline was strong even with the much higher price, until hurricane Katrina struck the Gulf Coast. When prices spiked to over $3 per gallon, demand fell sharply. But demand is now just below the same period in 2004. Note: weekly demand can vary considerably.
So in the short run, there will continue to be upward pressure on the prices of refined products. In the intermediate term, when the refineries are restored to full operation, there will be pressure on oil prices - if the economy stays reasonably healthy.
Therefore it is not unexpected to see oil prices fall - and they may fall some more. However there is a danger of much higher gasoline prices (and heating oil prices) if demand stays strong.
In the long run, the policy of encouraging oil consumption and relying on ever more oil production is probably doomed. The Financial Times touches on that topic:
"The US has not measurably increased fuel efficiency standards for vehicles in a generation and so we now lag behind China in these standards," said Paul Bledsoe of the National Commission on Energy Policy, a bipartisan body comprising industry executives and former policymakers.RESOURCES:
Here is the current Hurricane Katrina/Hurricane Rita Evacuation and Production Shut-in Statistics Report from the Minerals Management Service.
And here is the Energy Information Administration's daily report.
And the Department of Energy's This Week in Petroleum.
MBA: Mortgage Rates Increase
by Calculated Risk on 10/05/2005 11:00:00 AM
The Mortgage Bankers Association reports a slight decline in mortgage applications:
The Market Composite Index — a measure of mortgage loan application volume – was 713.5, a decrease of 1.1 percent on a seasonally adjusted basis from 721.2 one week earlier. On an unadjusted basis, the Index decreased 1.2 percent compared with the previous week and was down 1.8 percent compared with the same week one year earlier.The interest rate for 30-year fixed-rate mortgages increased to 5.94% and the interest rate for a 1 year ARM to 5.13 percent from 5.02 percent one week earlier. This is the 2nd week since early '02 that the 1 year ARM has been above 5%. (See graph on Angry Bear)
Refinance activity remains strong:
The refinance share of mortgage activity increased to 44.5 percent of total applications from 43.9 percent the previous week. The adjustable-rate mortgage (ARM) share of activity increased to 29.8 percent of total applications from 28.8 percent the previous week.With rising rates, I'm surprised at the level of refinance activity.


