 RSS Feed
 by Calculated Risk on 9/14/2005 01:16:00 PM
Wednesday, September 14, 2005
Gasoline Demand Continues to Fall
The DOE reports that gasoline demand fell to 8.636 million barrels per day for the week ending September 9, 2005, down from 9.027 m bbls/day for the pervious week.
UPDATE: Dr. Hamilton provides an excellent discussion and a weekly graph (as opposed to 4 wk average from DOE).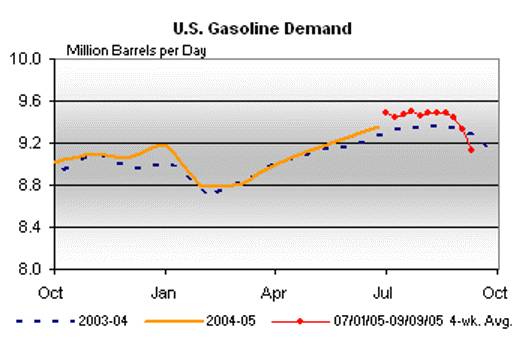
Click on graph for larger image.
Demand for gasoline usually falls after labor day, but this still represents a 6% drop in demand for the comparable week from 2004. Prices for "Retail Average Regular Gasoline" dropped about 3% to $2.96 from the record $3.06 the previous week. Based on futures prices for unleaded gasoline, it appears prices will drop further this week.
Tuesday, September 13, 2005
US Bank Economist: Recession Imminent
by Calculated Risk on 9/13/2005 08:07:00 PM
The Rocky Mountain News reports:
Economist Tucker Hart Adams said today it's not a question of if the U.S. economy slips into recession — it's just a matter of when.Here is the economic forecast. The conclusion:
Adams, giving her annual forecast at a breakfast for U.S. Bank customers, predicted 3.0 percent growth in the economy for 2006, down from an estimated 3.5 percent in 2005 and 4.2 percent in 2004.
But that's what she calls the "glass half full" scenario. The "glass half empty, and leaking" possibility is a recession in 2006 or 2007.
Adams continues to be concerned about consumer debt, unsustainable housing price increases, and high oil prices.
"Will (the recession) begin in 2006, or will we keep fooling ourselves, thinking we can spend more than we make and go further and further into debt? I don't know."
This is the glass half full forecast. The economy stands at a fork in the road as we move through 2006, and we can make an equally compelling case for a year that ends in recession for the nation and most of the industrialized world. If the Chinese economy crashes, if Asian central governments stop buying U.S. government securities and interest rates move up 150-200 basis points, if there is an outbreak of trade protectionism in the U.S. that spreads around the globe, if the housing bubble bursts, if U.S. debt and deficits – consumer, government and/or current account – become unmanageable, if oil prices continue to rise – any combination of these and perhaps no more than a single one makes a recession inevitable. In terms of a mild recession, it is only a question of when it occurs, in 2006 or a year or so later. At some point U.S. consumers must bring their debt under control and housing prices must reflect demand for living space rather than Ponzischeme speculation. At worst, the eerie parallels with 1929 turn out to be predictive and we face a long period of difficult economic times.
Trade Deficit: Another Look
by Calculated Risk on 9/13/2005 06:45:00 PM
General Glut and Dr. Setser have some excellent analysis on the trade deficit today. In the comments of General Glut's blog, Vorpal points out that the trade deficit is a record NSA (Not Seasonally Adjusted). Vorpal wrote:
"I wouldn't trust the [seasonal] adjustments because the nature of the deficit is changing so rapidly that historical precedent may be inaccurate."Comment on Seasonal Adjustment: I believe the Census Bureau and the Bureau of Economic Analysis does the best possible job of seasonally adjusting these numbers. Vorpal makes a keen observation; the nature of portions of the deficit are changing rapidly and we need to look at several months worth of data and consider the NSA data too. For a brief description of adjustments, see this post (2nd graph and discussion). Although I didn't discover any apparent problems with the seasonal adjustment, Vorpal's comments did lead me to the following:

Click on graphs for larger images.
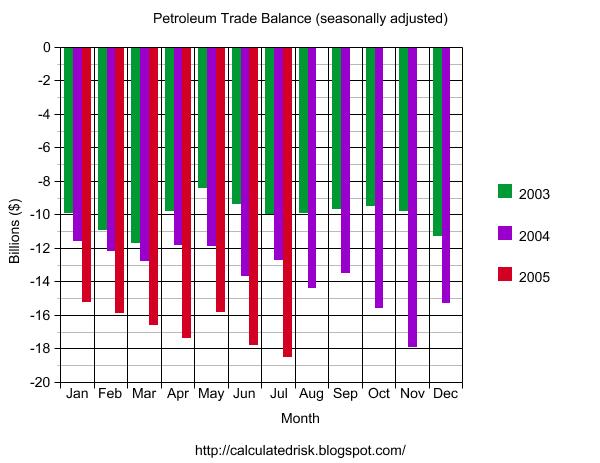
If we break down the NSA imports into three components (petroleum, China, and other) we see something possibly interesting. Petroleum imports are growing significantly and set another record in July.
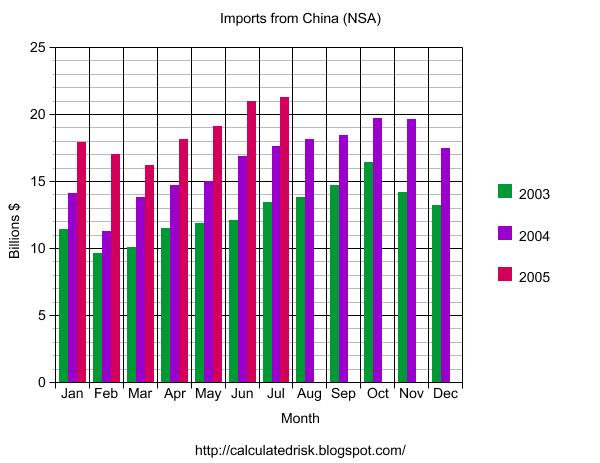
Imports from China also set another record in July. Imports from China follow a clear seasonal pattern and we can expect imports to continue to rise for the next several months.
NOTE: The Long Beach and Los Angeles ports implemented the OffPeak initiative (adds late night hours to port operations) starting on July 23rd to handle the expected heavier late summer / fall imports. I expect August to be a strong month for imports from China.
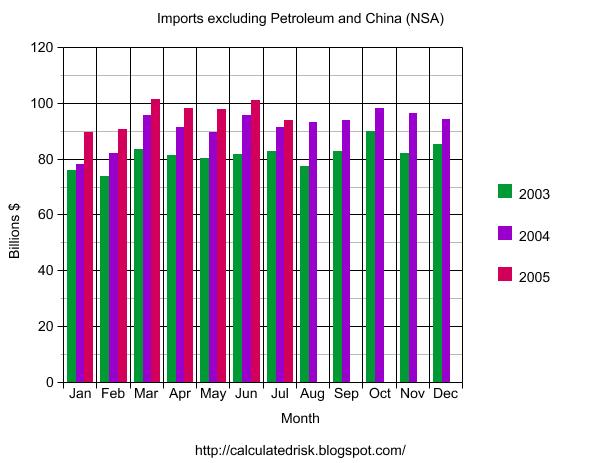
While Petroleum imports and imports from China are setting records, other imports have shown relatively sluggish growth.
Perhaps the relatively weak dollar has slowed imports from other countries.
The final graph shows the trade deficit for goods excluding imports and exports of petroleum and China.
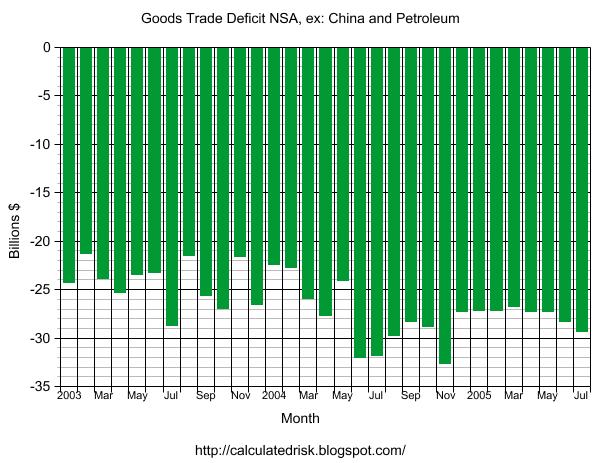
This graph shows that the "other" goods trade deficit (excluding services, and goods with China and Petroleum) peaked last summer. Perhaps that is why the dollar stopped falling earlier this year. Unfortunately it appears the "other" deficit is starting to climb again, and combined with more NSA records for China and petroleum products, I expect record SA trade deficit numbers over the next few months.
O.C. housing price hits $617,000
by Calculated Risk on 9/13/2005 11:35:00 AM
The OC Register reports:
The median housing selling price hit another record in August – the sixth peak in seven months – at $617,000, DataQuick reported this morning.Back in March I wrote that they were giving away "Free Money" in Orange County. The median price was $555K in March, so the price has increased $62K in 5 months (11%). OC Realtor Gary Watt's prediction of $70K in gains this year for a median priced home is looking good.
That's up from $601,000 in July and a 13 percent jump from the same month last year when fears were mounting that the local housing market was in trouble.
Sales were brisk in August as 4,708 units were sold. That's a 25 percent jump in pace from August 2004 amid that year's summertime doldrums.
US Trade Deficit: $57.9 Billion for July
by Calculated Risk on 9/13/2005 08:30:00 AM
The U.S. Census Bureau and the U.S. Bureau of Economic Analysis released the monthly trade balance report today for July:
"... total July exports of $106.2 billion and imports of $164.2 billion resulted in a goods and services deficit of $57.9 billion, $1.6 billionNote: all numbers are seasonally adjusted.
less than the $59.5 billion in June, revised.
July exports were $0.4 billion more than June exports of $105.8 billion. July imports were $1.1 billion less than June imports of $165.3 billion."

Click on graph for larger image.
July 2005 was 13% worse than July 2004. For the first seven months of 2005, the trade deficits is up 18% over the same period in 2004.
Imports from China set another record of $21,283 Billion. Imports from Japan were off slightly to $11,363 Billion.
The average contract price for oil set a new record of $49.03 per barrel breaking the old record of $44.76 in April.
The SA petroleum trade deficit set another record of $18.5 Billion.
With record imports from China and a record petroleum deficit, I'm surprised that the overall trade deficit wasn't a record; but it was close. I expect the deficit to widen over the rest of the year.


