 RSS Feed
 by Calculated Risk on 8/15/2005 12:42:00 PM
Monday, August 15, 2005
Fleckenstein: Top in Place for Housing Market
Bill Fleckenstein writes the Contrarian Chronicles for MSN Money. This week he touches on housing:
'To get a feeling for the budding inventory problem in many previously hot markets, let's look at a less-hot market (via the following vignette from a reader of this column): A publicly held home-building company (which shall remain nameless) in Columbus, Ohio, has been buying back homes from financially distressed owners and reselling them, at reduced prices, only to folks who are approved for conventional mortgages. As the reader says: "The inventory of homes is growing -- including one cul-de-sac where a staggering 13 of 20 homes, all less than three years old, are already up for sale."'And on subprime mortgages:
'... a contact in the subprime-lending arena (lenders who specialize in making loans to borrowers with less-than-stellar credit records) suggests to me that it's becoming increasingly difficult for originators of subprime mortgages to sell them at a profit. Unless all of these are booked on the originator's own balance sheet, we'll start to see credit being cut off to the more marginal real-estate speculators -- the driving force, at the margin, behind the real-estate market.'Fleck concludes:
'...the macro winds have shifted, I believe, and none of those shifts has occurred in a way that is bullish for U.S. assets. Bottom line: It's my opinion that a top is being formed (or is already in place), both in the housing market and the stock market. That spells trouble for an economy built on the unsustainable strategy of trying to speculate our way to prosperity.'Fleck has been very bearish for a number of years. He was early (but correct) on the NASDAQ. And he has also been early on housing.
The housing market was very strong in the 2nd quarter. However it does appear that inventories are building and, as Fleck suggests, a top may be close.
CNN: Home prices post record gains
by Calculated Risk on 8/15/2005 12:38:00 PM
CNN reports:
Single-home price growth over the 12 months ending June 30 was the strongest in history, according to the National Association of Realtors.See the article for a list of the top 10 markets. Durham, North Carolina is #9?
In its quarterly survey, NAR found that U.S. home prices rose at an annual rate of 13.6 percent, to a median price of $208,300.
Of the 149 metro areas surveyed, 67 showed gains of more than 10 percent.
David Lereah, NAR's chief economist, called the increases unprecedented. "When you look at appreciation of home prices relative to the overall rate of inflation, these are the strongest increases on record," he said.
Oil, Trade and Housing
by Calculated Risk on 8/15/2005 12:49:00 AM
My most recent post is up on Angry Bear: Oil Prices Revisited.
It looks like oil imports will add about $1.2 Billion to the July trade deficit.
It is possible that higher oil prices are leading to lower interest rates! As Dr. Setser noted:
"High oil prices = oil windfall = global savings glut = low long-term rates ... and the low-long term rates help even as high oil prices hurt."And finally, back in March, I speculated that there was a relationship between housing and the trade deficit. In fact, it was possible that a virtuous cycle had developed that might become vicious when housing slows down.
UPDATE: Here are the graphics from the Virtuous-Vicious post.
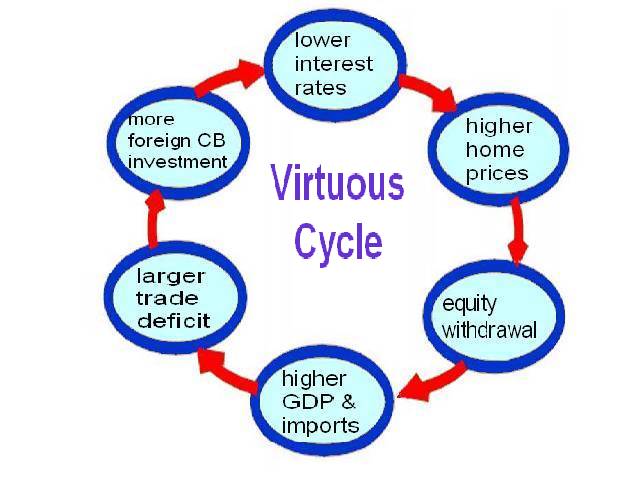
Click on diagram for larger image.
The following diagram depicts the possible unwinding of the current cycle.
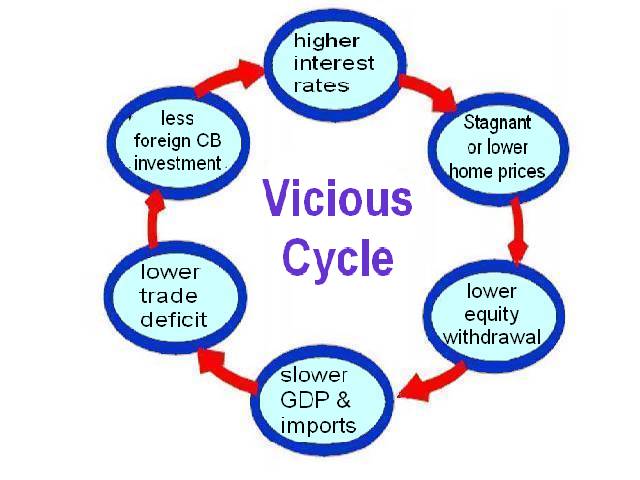
Check out the post for a discussion of how this could work (and some numbers).
It all ties together (hopefully). I'm focused mostly on housing because I think housing is the linchpin for the US economy.
Best to all.
Sunday, August 14, 2005
The "Rising tide of abandoned residential properties"
by Calculated Risk on 8/14/2005 12:17:00 AM
Real estate investors are just walking away from residential property and lenders are getting stuck. Some lenders do not want to take title to the worthless property and the city has started a campaign called the "shaming sign" - placing signs on abandoned property with the names of the lenders' executives. This has induced some lenders to take title and either fix up or demolish the abandoned homes.
This is a story from the Great Depression ... except it is happening right now in Dayton, Ohio.
... others have fallen victim to a conspiracy of carelessness and greed by lenders and their clients, many of them investors. When loans go bad, both duck for cover, their abandoned properties becoming a cancer on neighborhoods.With lax lending restrictions it is no surprise that areas with little or no appreciation are seeing rising foreclosures. I wonder if the "investors" were able to borrow against the home before just walking away from the loan.
This reality has led to a new strategy — the "shaming sign." Those who cut out on neighborhoods are held up to richly deserved embarrassment.
A major bank recently took charge of one of its neglected foreclosure properties; a bank official didn't like seeing his name on a sign.
Another big bank has been bobbing and weaving to avoid responsibility. Unable to sell a foreclosed property, it won't take title itself. Instead, it filed suit against its customer, leaving the property to languish and the city holding the bag.
Another property, though, on Helena Street could have a happy ending. A representative for the owner says the owner will tear the building down and deed the property to an adjacent community garden.
That action hasn't happened yet, but should it comes to pass, it will demonstrate the power and potential of the city's attack on abandoned properties.
Saturday, August 13, 2005
Trade Deficit Projection: June Review
by Calculated Risk on 8/13/2005 10:11:00 PM
Three months ago I started to build a simple model to project the trade deficit. I didn't make as much progress as I had hoped, but the first two components (oil and China) performed reasonably well for two months... but I underestimated China for June.
Here are my projections for June. My model projected a deficit of $17.0 Billion Seasonally Adjusted in energy related petroleum product imports. The actual number was $17.77 Billion (see Exhibit 9). This is an error of 4.3%.
For the trade balance with China, my model projected a deficit of $16.3B NSA (SA is not available). The actual number (see Exhibit 14) was $17.6B or an error of 7.3%.
Here are each of the components and how the model performed:
| ITEM | Projection | Actual | Error |
| US Exports to China (NSA) | $3.2B | $3.4 | 6% |
| US Imports from China (NSA) | $19.5B | $20.99B | 7% |
| US Trade Deficit: China (NSA) | $16.3B | $17.6B | 7% |
| Oil: Imports SA | $19.3B | $19.9B | 3% |
| Oil: Exports SA | $2.3B | $2.14B | 7% |
| OIL Balance SA | $17.0B | $17.77B | 4% |
Some internal data:
| ITEM | Projection | Actual | Error |
| Oil: Contract Price BBL | $45.11 | $44.40 | 1.6% |
| Oil: BBLs Crude | 328.0 | 328.3M | 0% |
| Oil: Price Other BBL | $51.88 | $51.58 | <1% |
| Oil: BBLs Other | 90M | 103.7M | 13% |
| Oil: Oil Imports NSA | $19.5B | $19.9B | 2% |
I really missed on China. I wondered about the surge in imports at LA and attributed them to Japan (imports in Japan were up $1.26B). Overall, my guess of $57.7B was on the high end of estimates, and I still underestimated the deficit for June!


