 RSS Feed
 by Calculated Risk on 7/14/2005 08:50:00 PM
Thursday, July 14, 2005
Housing Humor
"The joke now in Lee County [Florida] is when the cops pull you over they ask for your real estate license because not everyone has a driver's license."From this otherwise serious article: Housing boom fraught with disasters waiting to happen.
And a Las Vegas story: Valley Home Buying Fallout.
Dyan Harmell, a Pulte home buyer, is drowning in a sea of debt. Her living room table is covered with bills and she's not quite sure how to pay them.Hat tip to Ben Jones for Vegas story. As the Vegas article says: "The real estate boom that sent Las Vegas home prices skyrocketing may be over, but the hangover is only getting worse."
"There are bills everywhere. House payments and debt," Harmell told FOX5. She's a long way from those heady days of Las Vegas' real estate boom, when she says Pulte's sales staff pushed and pushed her to buy.
"They call you and say 'you are so lucky .. this just came across.. it's going to be worth 100k before it closes,'"said Dyan Harmell. "We came with the hopes of buying two houses. We left the first day owning four. Within the next week, owning 6 -- all the way up to 19."
But Harmell's story is not unique. Walk around Pulte's Solera neighborhood and it's a ghost town. It seems as if "For Sale" signs are everywhere.
Signs that many people who thought they'd make a killing in Las Vegas' real estate market are now trying to unload homes at deep discounts.
Deficit Improvement?
by Calculated Risk on 7/14/2005 04:37:00 PM
The following graph shows the fiscal year to date increase in the National Debt for each of the last six fiscal years. The "fiscal year" is the accounting period of the federal government. It begins on October 1st and ends on September 30th of the next calendar year. Each fiscal year is identified by the calendar year in which it ends - so fiscal year 2005 ends on September 30, 2005.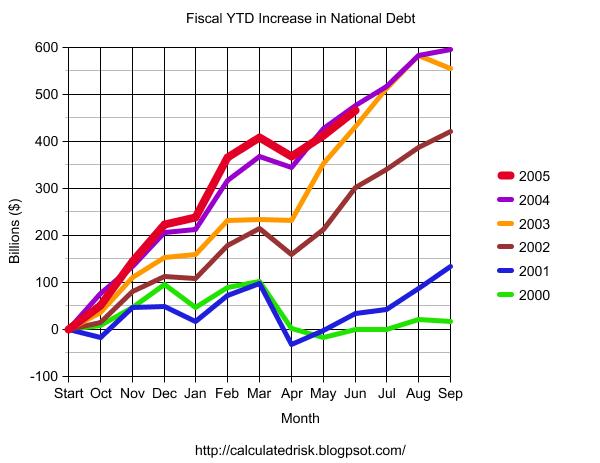
Click on graph for larger image.
The Year to Date increase in the National Debt is plotted for fiscal years 2000 through 2005. For 2005 (in RED) the data is plotted through June, 2005. The graph shows that contrary to the claims of the Bush Administration there has only been minor improvement in the overall deficit picture for 2005.
NOTE: There are many methods of looking at the annual budget deficit. The Bush Administration uses the "Enron Method" commonly called the "unified budget deficit". For a comparison of the unified budget deficit, the general fund deficit and the increase in the National Debt method see "Another Budget, Another Disaster".
Housing: The Bagholders
by Calculated Risk on 7/14/2005 11:47:00 AM
A couple weeks ago on Angry Bear, I quoted Econobrowser's Dr. Hamilton who asked: If there is a housing bubble,
"[W]hy are banks making loans to people who aren't going to be able to pay them back?"To try to answer Dr. Hamilton's question, I suggested we try to identify who would be left holding the bag and work backwards to motive.
Caroline Baum touches on the same topic in Enough About Loans. What About Lenders?
Forget the borrowers for a minute. Who's making these arguably risky loans? Why are lenders extending credit to seemingly bad credit risks?But this still doesn't identify the bagholders. Fannie Mae? Hedge Funds? Are investors underestimating the risk? Just more questions ...
One answer is that they aren't taking the risk. Rather, the risk is spread out, diluted. Lenders sell the loans, or the loans are securitized, in which case investors assume the risk.
As Federal Reserve Chairman Alan Greenspan reiterates, highly efficient capital markets in the U.S. diversify the risk, transferring it from those who don't want it to those who do.
Still, ``someone is taking on a lot of risk for someone to be able to take on less risk,'' [Michael Carliner, an economist at the National Association of Homebuilders in Washington] says.
Spreading the Risk
Then there's the question of whether risk is being priced correctly.
``There's been a dramatic explosion in lending to people with poorer credit-management history, and not a lot of history how certain loan products will perform,'' says Doug Duncan, chief economist at the Mortgage Bankers Association in Washington. ``We have no experience in 10-year interest-only mortgages.''
The risks apply to all parties in the transaction, Duncan says.
``For the borrower, did he understand how the loan would change?'' he says. For the servicer of the mortgage, ``did he understand how the loan would perform? Would it pre-pay faster, go delinquent? For the investor, did it achieve the yield expectations?''
OK, so the risk is spread out among various parties. Still, banks and thrifts do hold loans, especially ARMs, Duncan says. Won't they get stuck if the value of the house goes down, the borrower defaults and the lender can't recoup what was owed -- multiplied many times over?
Trade Deficit Projection: May Review
by Calculated Risk on 7/14/2005 01:24:00 AM
Two months ago I started to build a simple model to project the trade deficit. I didn't make as much progress as I had hoped, but the first two components (oil and China) have performed reasonably well for two months..
First, I projected the oil trade balance. And then I projected the trade deficit with China.
My model projected a deficit of $15.5 Billion Seasonally Adjusted in energy related petroleum product imports. The actual number was $15.8 Billion (see Exhibit 9). This is an error of just under 2%.
For the trade balance with China, my model projected a deficit of $15.5B NSA (SA is not available). The actual number (see Exhibit 14) was $15.7B or an error of 1.2%.
Here are each of the components and how the model performed:
| ITEM | Projection | Actual | Error |
| US Exports to China (NSA) | $3.4B | $3.3B | 3% |
| US Imports from China (NSA) | $18.9B | $19.05B | <1% |
| US Trade Deficit: China (NSA) | $15.5B | $15.75B | 1.6% |
| Oil: Imports SA | $17.4B | $18.1B | 3.9% |
| Oil: Exports SA | $1.9B | $2.3B | 17% |
| OIL Balance SA | $15.5B | $15.8B | 2% |
Some internal data:
| ITEM | Projection | Actual | Error |
| Oil: Contract Price BBL | $42.88 | $43.08 | <1% |
| Oil: BBLs Crude | 337.9M | 318.6M | 6% |
| Oil: Price Other BBL | $49.31 | $48.99 | <1% |
| Oil: BBLs Other | 85M | 99.7M | 15% |
| Oil: Oil Imports NSA | $18.7B | $18.6B | <1% |
It appears my SA factor for oil imports was somewhat off the mark. I'll have to take another look at that step. There is much more to do!
Wednesday, July 13, 2005
US Trade Deficit: $55.3 Billion for May
by Calculated Risk on 7/13/2005 08:33:00 AM
The U.S. Census Bureau and the U.S. Bureau of Economic Analysis released the monthly trade balance report today for May:
"... total May exports of $106.9 billion and imports of $162.2 billion resulted in a goods and services deficit of $55.3 billion, $1.6 billion less than the $56.9 billion in April, revised.Note: all numbers are seasonally adjusted.
May exports were $0.2 billion more than April exports of $106.7 billion.
May imports were $1.4 billion less than April imports of $163.6 billion."

Click on graph for larger image.
UPDATE: fixed a couple of errors.
May
The average contract price for oil dropped from a record $44.76 per barrel in April to $43.08 in May. The temporary drop in oil prices lowered the impact of oil on the trade deficit for May. However, the June trade deficit will be impacted by record high oil prices again.
I think the deficit will start to expand again starting in June.


