 RSS Feed
 by Calculated Risk on 5/09/2005 09:36:00 PM
Monday, May 09, 2005
Update on UK Housing
Forbes reported today that UK housing prices are up " 0.31 pct from the previous quarter". That is a slight decline in real terms. However the "volume of sales decreased by 34.77 pct". That is exactly how a housing bust usually works:
"Housing "bubbles" typically do not "pop”, rather prices tend to deflate slowly in real terms, over several years. Historically real estate prices display strong persistence and are sticky downward. Sellers want a price close to recent sales in their neighborhood, and buyers, sensing prices are declining, will wait for even lower prices. This means real estate markets do not clear immediately, and what we usually observe is a drop in transaction volumes."It is the drop in transaction volumes that causes general economic problems (slower retail sales, lower employment, etc.).
UPDATE: In the comments, David Bennett recommends General Glut's comments. Globblog is an excellent site!
See this morning's post on Angry Bear concerning UK housing: When will Housing Slowdown?
March Trade Deficit (Due Wednesday)
by Calculated Risk on 5/09/2005 02:50:00 PM
The current projection for the March trade deficit is $61.2 Billion (briefing.com) to $61.7 Billion (NYTimes). My feeling is this projection is on the low side.
In the comments to a previous post, Brad Setser excerpted some of Morgan's view ($61.2 Billion forecast) on oil:
On the imports side, a sharp rise in oil prices should more than offset some moderation in volumes and lead to another sizable increase in petroleum products.First, according to the Census Bureau, the contract price for imported crude in Feb was $36.85. According to the DOE, the contract price for Mar was close to $46. Also there was no "moderation in volumes" according to the DOE:
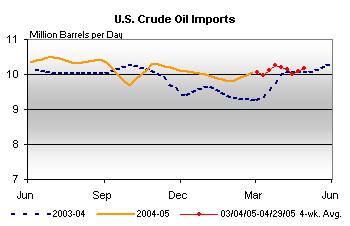
Click on graph for larger image.
Source: Dept of Energy
The cost for imported energy related petroleum products was $14.9 Billion in February. The cost for imported petroleum in March will be approximately $20 Billion.
The uncertainty in this report is from the impact of slowing US demand in March (the "soft patch") and the impact of the slowing economies in Europe. (See Ken's comments too) Trade with China is the largest contributor to the trade deficit, and it appears that China's economy was still going strong in March (about 25% of the total goods deficit in February was to China).
Finally, Morgan concludes with:
"Note that our forecast trade deficit is about the same as the Bureau of Economic Analysisassumed in preparing the advance estimate of Q1 GDP."If Morgan is underestimating the trade deficit, then there will also be a significant reduction in Q1 GDP.
Sunday, May 08, 2005
More on housing and the UK
by Calculated Risk on 5/08/2005 11:49:00 PM
My most recent post is up at Angry Bear: When will Housing Slowdown?
There is more bad news from the UK and I think the UK might be leading the US by 6 to 8 months with a housing slowdown.
UPDATE: U.K. Manufacturing Output Slumps
U.K. manufacturing had its biggest drop in almost three years in March, pushing industry closer to recession and damping expectations of higher interest rates after the Bank of England left its benchmark rate unchanged today.
Factory production, which accounts for 16 percent of the economy, dropped 1.6 percent from February, the National Statistics office said in London today. The median forecast in a Bloomberg survey of 26 economists was for a 0.1 percent increase.
The decline in manufacturing comes on top of signs of a slowdown in consumer spending in the U.K.'s 1.1 trillion-pound ($2.1 trillion) economy.
Best to all.
Friday, May 06, 2005
Not Seasonally Adjusted Non-Farm Payroll
by Calculated Risk on 5/06/2005 07:16:00 PM
In the previous post I cautioned about the difference between seasonally adjusted data and not seasonally adjusted data. The reason was some commentators were misusing the birth / death model that is not seasonally adjusted.
Click on graph for larger image.
This illustrates why the BLS reports seasonally adjust job growth. There is a very distinct pattern to hiring / firing. As an example, every January all of the temporary retail help is let go.
For the current month, 1.179 million new "not seaonally adjusted" jobs were created according to the payroll report. The BLS reported 274 thousand new jobs. They seasonally adjust each category, so it is very difficult to determine the actual factors.
For those that want to check these numbers, go here. Just check the boxes for both "Not seasonally adjusted" and "Seasonally Adjusted" Total nonfarm employment. Then click on Retrieve Data.
Two charts will appear. For seasonally adjusted: If you subtract the March number from April you will get the headline number of 274K. For not seasonally adjusted: If you do the same subtraction (March from April) you will get the 1.179 Million number.
CAUTION: Don't use the "Not Seasonally Adjusted" for anything except these exercises. Take a look at January - we lost 2.692 Million jobs! (but seasonally adjusted we gained 124K). We lose a ton of jobs every January and July for seasonal reasons ... this is a series that really needs seasonal adjustment.
The BLS Employment Birth / Death Model
by Calculated Risk on 5/06/2005 12:10:00 PM
In some net discussions, there appears to be some confusion over a component of the jobs report. Today's very good report had a headline number of 274 thousand jobs created in April.
Several places on the internet have pointed out that the birth / death model added 257 thousand jobs to the payroll report. Then they argue that 257K of the 274K were from estimated jobs created by new business. This is incorrect and is a lesson in mixing seasonally adjusted numbers with "not seasonally" adjusted numbers.
The headline seasonally adjusted number for April is 274K jobs. The not seasonally adjusted birth /death model (jobs generated by new business formations) was 257K.
The actual BLS reported jobs created in April was 1.179 Million (before seasonal adjustment). Of these 1.179 million jobs, 257K came from the birth/death model (or about 22%).
If you follow the link to the birth/death model you will see:
"Note that the the net birth/death figures are not seasonally adjusted, and are applied to not seasonally adjusted monthly employment links to determine the final estimate."Finally, when the 1.179 Million jobs is seasonally adjusted you get 274 Thousand headline number.
Also note the BLS caveat:
"The most significant potential drawback to this or any model-based approach is that time series modeling assumes a predictable continuation of historical patterns and relationships and therefore is likely to have some difficulty producing reliable estimates at economic turning points or during periods when there are sudden changes in trend. BLS will continue researching alternative model-based techniques for the net birth/death component; it is likely to remain as the most problematic part of the estimation process."


