 RSS Feed
 by Calculated Risk on 7/28/2025 09:09:00 PM
Monday, July 28, 2025
Tuesday: Case-Shiller House Prices, Job Openings
 From Matthew Graham at Mortgage News Daily: Mortgage Rates Hold Perfectly Flat to Start New Week
If any given week of movement in the mortgage rate world came with disclaimer, this one would be: "Warning. An absence of volatility on Monday has no bearing on odds for volatility in the rest of the week." More simply put, you're essentially guaranteed to see more rate movement over the next 4 days simply because today saw none.Tuesday:
Of all of the days this week, Monday was the best candidate for a ho-hum level of movement because it was the only day without any major economic data on tap. Rates are based on bonds, and econ data is a key source of inspiration for bonds. [30 year fixed 6.81%]
emphasis added
• At 9:00 AM ET, S&P/Case-Shiller House Price Index for May. The consensus is for a 2.5% year-over-year increase in the Comp 20 index for May.
• At 9:00 AM, FHFA House Price Index for May. This was originally a GSE only repeat sales, however there is also an expanded index.
• At 10:00 AM, Job Openings and Labor Turnover Survey for June from the BLS.
Fannie and Freddie: Single Family Serious Delinquency Rates Decreased in June
by Calculated Risk on 7/28/2025 05:09:00 PM
Today, in the Calculated Risk Real Estate Newsletter: Fannie and Freddie: Single Family Serious Delinquency Rates Decreased in June
Excerpt:
Freddie Mac reported that the Single-Family serious delinquency rate in June was 0.55%, unchanged from 0.55% May. Freddie's rate is up year-over-year from 0.50% in June 2024, however, this is below the pre-pandemic level of 0.60%.
Freddie's serious delinquency rate peaked in February 2010 at 4.20% following the housing bubble and peaked at 3.17% in August 2020 during the pandemic.
Fannie Mae reported that the Single-Family serious delinquency rate in May was 0.53%, down from 0.55% in April. The serious delinquency rate is up year-over-year from 0.48% in May 2024, however, this is below the pre-pandemic lows of 0.65%.
Fannie Mae reported that the Single-Family serious delinquency rate in June was 0.53%, unchanged from 0.53% in May. The serious delinquency rate is up year-over-year from 0.48% in June 2024, however, this is below the pre-pandemic lows of 0.65%.

There is much more in the article.
HVS: Q2 2025 Homeownership and Vacancy Rates
by Calculated Risk on 7/28/2025 01:09:00 PM
The Census Bureau released the Residential Vacancies and Homeownership report for Q2 2025 today.
The results of this survey were significantly distorted by the pandemic in 2020.
This report is frequently mentioned by analysts and the media to track household formation, the homeownership rate, and the homeowner and rental vacancy rates. However, there are serious questions about the accuracy of this survey.
This survey might show the trend, but I wouldn't rely on the absolute numbers. Analysts probably shouldn't use the HVS to estimate the excess vacant supply or household formation, or rely on the homeownership rate, except as a guide to the trend.
National vacancy rates in the second quarter 2025 were 7.0 percent for rental housing and 1.1 percent for homeowner housing. The rental vacancy rate was higher than the rate in the second quarter 2024 (6.6 percent) and not statistically different from the rate in the first quarter 2025 (7.1 percent).
The homeowner vacancy rate of 1.1 percent was higher than the rate in the second quarter 2024 (0.9 percent) and virtually the same as the rate in the first quarter 2025 (1.1 percent).
The homeownership rate of 65.0 percent was not statistically different from the rate in the second quarter 2024 (65.6 percent) and not statistically different than the rate in the first quarter 2025 (65.1 percent).
emphasis added
 Click on graph for larger image.
The Red dots are the decennial Census homeownership rates for April 1st, 1990, 2000, 2010, and 2020.
The HVS homeownership rate was decreased to 65.0% in Q2, from 65.1% in Q1.
The HVS homeownership rate was decreased to 65.0% in Q2, from 65.1% in Q1.
The results in Q2 and Q3 2020 were distorted by the pandemic and should be ignored.
 The HVS homeowner vacancy was unchanged at 1.1% in Q2 from 1.1% in Q1.
 The homeowner vacancy rate declined sharply during the pandemic and includes homes that are vacant and for sale (so this mirrors the low but increasing levels of existing home inventory).
Once again - this probably shows the general trend, but I wouldn't rely on the absolute numbers.
 The rental vacancy rate decreased to 7.0% in Q2 from 7.1% in Q1. This is up from the low of 5.6% in 2021 and 2022.
The quarterly HVS is the timeliest survey on households, but there are many questions about the accuracy of this survey.
TSA: Airline Travel Mostly Unchanged YoY
by Calculated Risk on 7/28/2025 11:01:00 AM
Here are the daily travel numbers from the TSA.
This data is as of July 27, 2025.
 Click on graph for larger image.
This data shows the 7-day average of daily total traveler throughput from the TSA for the last 6 years.
Air travel is essentially unchanged YoY (7-day average up about 0.5% YoY).
The red line is the seven-day average for 2025.
The red line is the seven-day average for 2025.
2020 (black) was the worst year for air travel due to COVID. Each year that followed showed a pickup in air travel, with 2023 (yellow) finally reaching 2019 levels (light blue).
There is no growth this year with air travel mostly tracking 2024 levels.
Housing July 28th Weekly Update: Inventory up 0.4% Week-over-week; Down 10% from 2019 Levels
by Calculated Risk on 7/28/2025 08:11:00 AM
Altos reports that active single-family inventory was up 0.4% week-over-week.
Inventory is now up 37.8% from the seasonal bottom in January. Usually, inventory is up about 22% from the seasonal low by this week in the year. So, 2025 is seeing a larger than normal increase in inventory.
The first graph shows the seasonal pattern for active single-family inventory since 2015.
 Click on graph for larger image.
The red line is for 2025. The black line is for 2019.
Inventory was up 27.0% compared to the same week in 2024 (last week it was up 28.2%), and down 10.3% compared to the same week in 2019 (last week it was down 10.8%).
It now appears inventory will be close to 2019 levels towards the end of 2025.
 This second inventory graph is courtesy of Altos Research.
As of July 25th, inventory was at 860 thousand (7-day average), compared to 857 thousand the prior week.
Mike Simonsen discusses this data and much more regularly on Youtube
Sunday, July 27, 2025
Sunday Night Futures
by Calculated Risk on 7/27/2025 07:46:00 PM
Weekend:
• Schedule for Week of July 27, 2025
Monday:
• At 10:00 AM ET, the Q2 2025 Housing Vacancies and Homeownership from the Census Bureau.
• At 10:30 AM, Dallas Fed Survey of Manufacturing Activity for July.
From CNBC: Pre-Market Data and Bloomberg futures S&P 500 are up 28 and DOW futures are up 168 (fair value).
Oil prices were down over the last week with WTI futures at $65.16 per barrel and Brent at $68.44 per barrel. A year ago, WTI was at $79, and Brent was at $81 - so WTI oil prices are down about 20% year-over-year.
Here is a graph from Gasbuddy.com for nationwide gasoline prices. Nationally prices are at $3.12 per gallon. A year ago, prices were at $3.49 per gallon, so gasoline prices are down $0.37 year-over-year.
FOMC Preview: No Change to Fed Funds Rate
by Calculated Risk on 7/27/2025 09:01:00 AM
Most analysts expect no change to FOMC policy at the meeting this week, keeping the target range at 4 1/4 to 4 1/2 percent. Market participants currently expect the FOMC to cut the Fed Funds rate 25bp in September, with a second rate cut in December.
From BofA:
We do not expect any policy changes at the July Fed meeting. Most FOMC participants likely view this meeting as a placeholder. The balance of risks remains the same as in June: to the upside on inflation and to the downside on the labor market. The Fed will have a lot more information on how these risks have evolved by the September meeting. ...
August’s Jackson Hole Symposium further reduces the urgency to guide markets next week. The Fed will have an additional month’s worth of data by then. With the benefit of hindsight, it is clear that Powell used his Jackson Hole speech last year to signal the 50bp cut in September. This year, Powell will most likely be speaking on the morning of August 22. Although the focus will be on the framework review, we see a strong chance that Powell will also provide a signal on the near-term policy trajectory.
emphasis added
Projections will NOT be released at this meeting. For review, here are the June projections.
1 Projections of change in real GDP and inflation are from the fourth quarter of the previous year to the fourth quarter of the year indicated.
The unemployment rate was at 4.1% in June. The unemployment rate will likely increase later this year.
2 Projections for the unemployment rate are for the average civilian unemployment rate in the fourth quarter of the year indicated.
As of May 2025, PCE inflation increased 2.3% year-over-year (YoY), up from 2.2% YoY in April. Early estimate is PCE inflation will increase to 2.6% YoY in June. There will likely be some further increases in the 2nd half of 2025, but the forecast range is probably reasonable.
PCE core inflation increased 2.7% YoY in May, up from 2.6% YoY in April. There will likely be further increase in core PCE inflation.
Since the last projections were released, economic growth has been below expectations, the unemployment rate and inflation close to expectations.
The BEA's estimate for Q1 GDP showed real growth at -0.5% annualized. Most estimates for Q2 GDP, are around 2.5% (as distortions in Q1 reverse). That would put the first half real growth at 1.0% annualized, and it is likely growth will also be slow the 2nd half of 2025.
| GDP projections of Federal Reserve Governors and Reserve Bank presidents, Change in Real GDP1 | ||||
|---|---|---|---|---|
| Projection Date | 2025 | 2026 | 2027 | |
| Jun 2025 | 1.2 to 1.5 | 1.5 to 1.8 | 1.7 to 2.0 | |
| Mar 2025 | 1.5 to 1.9 | 1.6 to 1.9 | 1.6 to 2.0 | |
The unemployment rate was at 4.1% in June. The unemployment rate will likely increase later this year.
| Unemployment projections of Federal Reserve Governors and Reserve Bank presidents, Unemployment Rate2 | ||||
|---|---|---|---|---|
| Projection Date | 2025 | 2026 | 2027 | |
| Jun 2025 | 4.4 to 4.5 | 4.3 to 4.6 | 4.2 to 4.6 | |
| Mar 2025 | 4.3 to 4.4 | 4.2 to 4.5 | 4.1 to 4.4 | |
As of May 2025, PCE inflation increased 2.3% year-over-year (YoY), up from 2.2% YoY in April. Early estimate is PCE inflation will increase to 2.6% YoY in June. There will likely be some further increases in the 2nd half of 2025, but the forecast range is probably reasonable.
| Inflation projections of Federal Reserve Governors and Reserve Bank presidents, PCE Inflation1 | ||||
|---|---|---|---|---|
| Projection Date | 2025 | 2026 | 2027 | |
| Jun 2025 | 2.8 to 3.2 | 2.3-2.6 | 2.0 to 2.2 | |
| Mar 2025 | 2.6 to 2.9 | 2.1 to 2.3 | 2.0 to 2.1 | |
PCE core inflation increased 2.7% YoY in May, up from 2.6% YoY in April. There will likely be further increase in core PCE inflation.
| Core Inflation projections of Federal Reserve Governors and Reserve Bank presidents, Core Inflation1 | ||||
|---|---|---|---|---|
| Projection Date | 2025 | 2026 | 2027 | |
| Jun 2025 | 2.9 to 3.4 | 2.3-2.6 | 2.0 to 2.2 | |
| Mar 2025 | 2.7 to 3.0 | 2.1 to 2.4 | 2.0 to 2.1 | |
Saturday, July 26, 2025
Real Estate Newsletter Articles this Week: Existing-Home Sales Decreased to 3.93 million SAAR in June
by Calculated Risk on 7/26/2025 02:11:00 PM
At the Calculated Risk Real Estate Newsletter this week:
 Click on graph for larger image.
• NAR: Existing-Home Sales Decreased to 3.93 million SAAR in June; Unchanged YoY
• New Home Sales Increase to 627,000 Annual Rate in June
• Final Look at Local Housing Markets in June and a Look Ahead to July Sales
• NMHC on Apartments: Market conditions Tightened in Q2
• Goldman's Mid-Year Housing Outlook
• California Home Sales Down Slightly YoY in June
This is usually published 4 to 6 times a week and provides more in-depth analysis of the housing market.
Schedule for Week of July 27, 2025
by Calculated Risk on 7/26/2025 08:11:00 AM
The key reports this week are the advance estimate of Q2 GDP and the July employment report.
Other key reports include May Case-Shiller house prices, July ISM manufacturing index and July vehicle sales.
The FOMC meets this week and no change to the Fed Funds rate is expected.
10:00 AM: the Q2 2025 Housing Vacancies and Homeownership from the Census Bureau.
10:30 AM: Dallas Fed Survey of Manufacturing Activity for July.
 9:00 AM: S&P/Case-Shiller House Price Index for May.
This graph shows the year-over-year change in the seasonally adjusted National Index, Composite 10 and Composite 20 indexes through the most recent report (the Composite 20 was started in January 2000).
The consensus is for a 2.5% year-over-year increase in the Comp 20 index for May.
9:00 AM: FHFA House Price Index for May. This was originally a GSE only repeat sales, however there is also an expanded index.
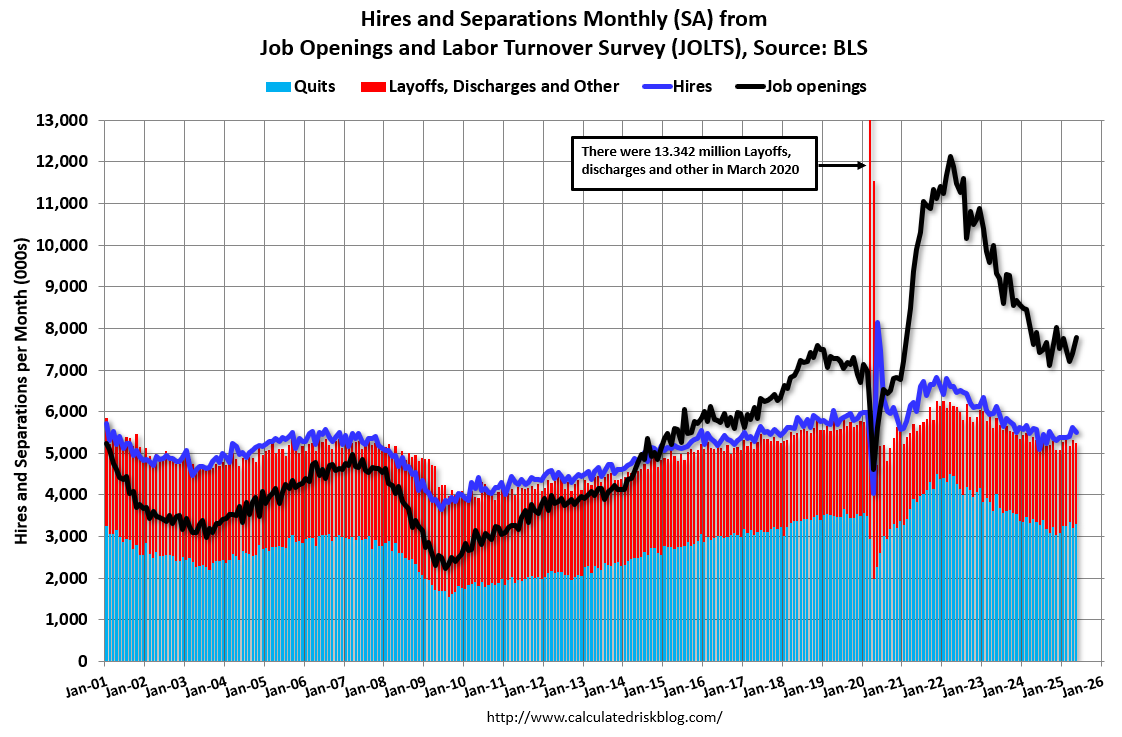 10:00 AM ET: Job Openings and Labor Turnover Survey for June from the BLS.
 This graph shows job openings (yellow line), hires (purple), Layoff, Discharges and other (red column), and Quits (light blue column) from the JOLTS.
Jobs openings increased in May to 7.77 million from 7.40 million in April.
The number of job openings (yellow) were down 2% year-over-year and Quits were down 2% year-over-year.
7:00 AM ET: The Mortgage Bankers Association (MBA) will release the results for the mortgage purchase applications index.
8:15 AM: The ADP Employment Report for June. This report is for private payrolls only (no government). The consensus is for 75,000 payroll jobs added in June, up from -33,000 in May.
8:30 AM: Gross Domestic Product, 2nd quarter (advance estimate), and annual update. The consensus is that real GDP increased 2.5% annualized in Q2, up from -0.5% in Q1.
10:00 AM: Pending Home Sales Index for June. The consensus is for a 0.3% increase in the index.
2:00 PM: FOMC Meeting Announcement. No change to the Fed Funds rate is expected.
2:30 PM: Fed Chair Jerome Powell holds a press briefing following the FOMC announcement.
8:30 AM: The initial weekly unemployment claims report will be released. The consensus is for initial claims to increase to 220 thousand from 217 thousand last week.
8:30 AM ET: Personal Income and Outlays, June 2025. The consensus is for a 0.3% increase in personal income, and for a 0.4% increase in personal spending. And for the Core PCE price index to increase 0.3%. PCE prices are expected to be up 2.5% YoY, and core PCE prices up 2.7% YoY.
9:45 AM: Chicago Purchasing Managers Index for July.
 8:30 AM: Employment Report for July. The consensus is for 118,000 jobs added, and for the unemployment rate to increase to 4.2%.
There were 147,000 jobs added in June, and the unemployment rate was at 4.1%.
This graph shows the jobs added per month since January 2021.
10:00 AM: ISM Manufacturing Index for July. The consensus is for the ISM to be at 49.8, up from 49.0 in June.
10:00 AM: Construction Spending for June. The consensus is for a 0.1% increase in construction spending.
10:00 AM: University of Michigan's Consumer sentiment index (Final for July).
 Late: Light vehicle sales for July from the BEA. The consensus is for light vehicle sales to be 16.2 million SAAR in July, up from 15.3 million in June (Seasonally Adjusted Annual Rate).
This graph shows light vehicle sales since the BEA started keeping data in 1967. The dashed line is the sales rate for last month.
Friday, July 25, 2025
Realtor.com Reports Most Active "For Sale" Inventory since November 2019
by Calculated Risk on 7/25/2025 05:01:00 PM
What this means: On a weekly basis, Realtor.com reports the year-over-year change in active inventory and new listings. On a monthly basis, they report total inventory. For June, Realtor.com reported inventory was up 28.9% YoY, but still down 12.9% compared to the 2017 to 2019 same month levels.
Here is their weekly report: Weekly Housing Trends: Latest Data as of July 19
• Active inventory climbed 24.4% year over year
The number of homes active on the market climbed 24.4% year over year, slightly lower than last week. This represents the 89th consecutive week of annual gains in inventory. There were more than 1 million homes for sale again last week, marking the 11th week in a row over the threshold and the highest inventory level since November 2019.
• New listings—a measure of sellers putting homes up for sale—rose 7.2% year over year
New listings rose again last week on an annual basis by 7.2% compared with the same period last year. The June Housing Report showed that new listings declined month over month for the second consecutive month after peaking in April. This figure suggests that the trend could turn around soon.
• The median list price was up 0.8% year over year
The median list price climbed again this week, but is still down 0.2% year to date. The median list price per square foot—which adjusts for changes in home size—rose 0.5% year over year. With inventory on the rise and more than 1 in 5 sellers cutting prices, the market continues to soften and shift toward more buyer favorability.
Q2 GDP Tracking: Mid-2s
by Calculated Risk on 7/25/2025 02:01:00 PM
The advance estimate of Q2 GDP will be released next Wednesday. The consensus is real GDP increased at a 2.5% annual rate in Q2. BofA economists noted this morning:
"The increase in the headline print would be on the back of a reversal of the surge in imports due to pre-tariff front loading in 1Q. Consumer spending should increase by 1.5% after the weather-driven 1Q decline. Equipment investment is likely to decline after the outsized increase in 1Q. Hence final sales will likely come in at a weak 0.3%."From BofA:
Since our last weekly publication, our 2Q GDP tracking is unchanged at 2.2% q/q saar. [July 25th estimate]From Goldman:
emphasis added
We left our Q2 GDP tracking estimate unchanged at +2.7% (quarter-over-quarter annualized) and our Q2 domestic final sales estimate unchanged at +0.9%. [July 25th estimate]And from the Atlanta Fed: GDPNow

The GDPNow model estimate for real GDP growth (seasonally adjusted annual rate) in the second quarter of 2025 is 2.4 percent on July 25, unchanged from July 18 after rounding. The forecasts of the major GDP subcomponents were all unchanged or little changed from their July 18 values after this week’s releases from the US Census Bureau and the National Association of Realtors. [July 25th estimate]
Final Look at Local Housing Markets in June and a Look Ahead to July Sales
by Calculated Risk on 7/25/2025 10:56:00 AM
Today, in the Calculated Risk Real Estate Newsletter: Final Look at Local Housing Markets in June and a Look Ahead to July Sales
A brief excerpt:
After the National Association of Realtors® (NAR) releases the monthly existing home sales report, I pick up additional local market data that is reported after the NAR. This is the final look at local markets in June.There is much more in the article.
There were several key stories for June:
• Sales NSA are down 1.5% year-over-year (YoY) through June compared to the same period in 2024, and sales last year were the lowest since 1995! The YoY comparisons will be fairly easy for the next three months, so sales in 2025 might be close to the level in 2024.
• Sales SA were down or unchanged YoY for the 5th consecutive month and have been down YoY for 41 of the last 46 months.
• Months-of-supply is at the highest level since 2016.
• The median price is barely up YoY, and with the increases in inventory, some regional areas will see more price declines - and we might see national price declines later this year (or in 2026).
Sales at 3.93 million on a Seasonally Adjusted Annual Rate (SAAR) basis were below the consensus estimate; however, housing economist Tom Lawler’s estimate was right on (usually very close).
Sales averaged close to 5.40 million SAAR for the month of June in the 2017-2019 period. So, sales are about 27% below pre-pandemic levels.
...
In June, sales in these markets were up 4.7% YoY NSA. Last month, in May, these same markets were also down 3.8% YoY Not Seasonally Adjusted (NSA). The NAR reported sales in June were up 4.0% YoY NSA, so this sample is close.
Important: There were more working days in June 2025 (20) than in June 2024 (19). So, the year-over-year change in the headline SA data was lower than for the NSA data. According to the NAR, seasonally adjusted sales were unchanged YoY in June.
...
More local data coming in August for activity in July!

Hotels: Occupancy Rate Decreased 2.6% Year-over-year; Weak Summer
by Calculated Risk on 7/25/2025 08:11:00 AM
The U.S. hotel industry reported negative year-over-year comparisons, according to CoStar’s latest data through 19 July. ...The following graph shows the seasonal pattern for the hotel occupancy rate using the four-week average.
13-19 July 2025 (percentage change from comparable week in 2024):
• Occupancy: 71.6% (-2.6%)
• Average daily rate (ADR): US$165.49 (-0.7%)
• Revenue per available room (RevPAR): US$118.54 (-3.3%)
emphasis added
 Click on graph for larger image.
The red line is for 2025, blue is the median, and dashed light blue is for 2024. Dashed purple is for 2018, the record year for hotel occupancy.
The 4-week average of the occupancy rate is tracking behind last year and the median rate for the period 2000 through 2024 (Blue).
Note: Y-axis doesn't start at zero to better show the seasonal change.
The 4-week average will likely increase over the next several weeks.
On a year-to-date basis, the only worse years for occupancy over the last 25 years were pandemic or recession years.
Thursday, July 24, 2025
Friday: Durable Goods
by Calculated Risk on 7/24/2025 07:54:00 PM
 Note: Mortgage rates are from MortgageNewsDaily.com and are for top tier scenarios.
Friday:
• At 8:30 AM ET,Durable Goods Orders for June from the Census Bureau. The consensus is for a 10.0% decrease in durable goods orders.
July Vehicle Forecast: Sales "Rebound"
by Calculated Risk on 7/24/2025 04:21:00 PM
From J.D. Power: New-Vehicle Retail Sales Up 4.1% for July and Consumer Spending Sets Record for Month with $49.8 Billion Spent on New Vehicles Brief excerpt:
The seasonally adjusted annualized rate (SAAR) for total new-vehicle sales is expected to be 16.4 million units, up 0.8 million units from July 2024.From Haig Stoddard at Omdia: US Light Vehicle Sales Headed for Rebound in July (pay content). Brief excerpt:
emphasis added
July US light-vehicle sales will improve on June's results, as the expected negative impacts from automotive tariffs are yet to fully kick in.
 Click on graph for larger image.
This graph shows actual sales from the BEA (Blue), and J.D. Power's forecast for July (Red).
On a seasonally adjusted annual rate basis, the J.D. Power forecast of 16.4 million SAAR would be down 6.9% from last month, and up 3.6% from a year ago.
ICE First Look at June Mortgage Performance: "Delinquencies Trend Slightly Higher in June"
by Calculated Risk on 7/24/2025 02:12:00 PM
From Intercontinental Exchange: ICE First Look at Mortgage Performance: Delinquencies Trend Slightly Higher in June as Foreclosure Activity Continues to Rise off Pandemic-Era Lows
Intercontinental Exchange, Inc. (NYSE:ICE) ... today released its June 2025 ICE First Look, which shows that while overall mortgage payment performance remains strong, delinquencies rose on a monthly basis while foreclosures trended notably higher year over year (YoY).
Key takeaways from the ICE First Look, which reports on month-end delinquency, foreclosure and prepayment statistics sourced from ICE’s loan-level database, include:
• The national delinquency rate rose by 15 basis points (bps) from May to 3.35% driven by early-stage delinquencies. FHA delinquencies, which tend to experience more seasonality, rose by 41 bps in the month, hitting their highest June level since 2013, excluding the 2020-2021 pandemic-era impact.
• Serious delinquencies (SDQs) – loans 90+ days past due but not in foreclosure – held steady but are up +8% (35K) YoY, with FHA loans now accounting for +51% of all SDQs nationwide.
• Foreclosure activity continues to rise off pandemic-era lows with the share of loans in active foreclosure up +10% from the same time last year. Foreclosure starts and sales both rose YoY in each of the past four months.
• Prepayment activity, measured in single month mortality, slipped by 6 bps to 0.65% on higher rates, although it remains up +22% from the same time last year.
emphasis added
 Click on graph for larger image.
Here is a table from ICE.
Newsletter: New Home Sales Increase to 627,000 Annual Rate in June
by Calculated Risk on 7/24/2025 10:49:00 AM
Today, in the Calculated Risk Real Estate Newsletter: New Home Sales Increase to 627,000 Annual Rate in June
Brief excerpt:
The Census Bureau reported New Home Sales in June were at a seasonally adjusted annual rate (SAAR) of 627 thousand. The previous three months were revised down, combined.There is much more in the article.
...
The next graph shows new home sales for 2024 and 2025 by month (Seasonally Adjusted Annual Rate). Sales in June 2025 were down 6.6% from June 2024.
New home sales, seasonally adjusted, have been down year-over-year for 6 consecutive months.

New Home Sales Increase to 627,000 Annual Rate in June
by Calculated Risk on 7/24/2025 10:00:00 AM
The Census Bureau reports New Home Sales in June were at a seasonally adjusted annual rate (SAAR) of 627 thousand.
The previous three months were revised down, combined.
Sales of new single-family houses in June 2025 were at a seasonally-adjusted annual rate of 627,000, according to estimates released jointly today by the U.S. Census Bureau and the Department of Housing and Urban Development. This is 0.6 percent above the May 2025 rate of 623,000, and is 6.6 percent below the June 2024 rate of 671,000.
emphasis added
 Click on graph for larger image.
The first graph shows New Home Sales vs. recessions since 1963. The dashed line is the current sales rate.
New home sales were below pre-pandemic levels.
The second graph shows New Home Months of Supply.
 The months of supply increased in June to 9.8 months from 9.7 months in May.
 The all-time record high was 12.2 months of supply in January 2009. The all-time record low was 3.3 months in August 2020.
This is well above the top of the normal range (about 4 to 6 months of supply is normal).
"The seasonally-adjusted estimate of new houses for sale at the end of June 2025 was 511,000. This is 1.2 percent above the May 2025 estimate of 505,000, and is 8.5 percent (±5.4 percent) above the June 2024 estimate of 471,000.Sales were below expectations of 650 thousand SAAR and sales for the three previous months were revised down, combined. I'll have more later today.
This represents a supply of 9.8 months at the current sales rate. The months' supply is 1.0 percent above the May 2025 estimate of 9.7 months, and is 16.7 percent above the June 2024 estimate of 8.4 months."
Weekly Initial Unemployment Claims Decrease to 217,000
by Calculated Risk on 7/24/2025 08:30:00 AM
The DOL reported:
In the week ending July 19, the advance figure for seasonally adjusted initial claims was 217,000, a decrease of 4,000 from the previous week's unrevised level of 221,000. The 4-week moving average was 224,500, a decrease of 5,000 from the previous week's unrevised average of 229,500.The following graph shows the 4-week moving average of weekly claims since 1971.
emphasis added
 Click on graph for larger image.
The dashed line on the graph is the current 4-week average. The four-week average of weekly unemployment claims decreased to 224,500.
The previous week was unrevised.
Weekly claims were lower than the consensus forecast.
Wednesday, July 23, 2025
Thursday: New Home Sales, Unemployment Claims
by Calculated Risk on 7/23/2025 07:53:00 PM
 Note: Mortgage rates are from MortgageNewsDaily.com and are for top tier scenarios.
Thursday:
• At 8:30 AM, The initial weekly unemployment claims report will be released. The consensus is for initial claims to increase to 230 thousand from 221 thousand last week.
• Also t 8:30 AM, Chicago Fed National Activity Index for June. This is a composite index of other data.
• At 10:00 AM, New Home Sales for June from the Census Bureau. The consensus is for 650 thousand SAAR, up from 623 thousand in May.
• At 11:00 AM, Kansas City Fed Survey of Manufacturing Activity for July.


