 RSS Feed
 by Calculated Risk on 7/02/2025 09:44:00 AM
Wednesday, July 02, 2025
Heavy Truck Sales Decreased in June
This graph shows heavy truck sales since 1967 using data from the BEA. The dashed line is the June 2025 seasonally adjusted annual sales rate (SAAR) of 435 thousand.
Note: "Heavy trucks - trucks more than 14,000 pounds gross vehicle weight."
 Click on graph for larger image.
Heavy truck sales were at 435 thousand SAAR in June, down from 450 thousand in May, and down 1.4% from 442 thousand SAAR in June 2024.
This is the lowest sales rate since January 2022.
Year-to-date (NSA) sales are down 6.2%.
Usually, heavy truck sales decline sharply prior to a recession and sales were a little soft recently.
Light Vehicles Sales Decreased to 15.34 million SAAR in June
by Calculated Risk on 7/02/2025 08:52:00 AM
The BEA reported this morning that light vehicle sales were at 15.34 million in June on a seasonally adjusted annual rate basis (SAAR).
This was down 1.7% from the sales rate in May, and up 2.3% from June 2024.
Note that sales in June 2024 were depressed by a cyberattack impacting dealers’ online systems. This makes the YoY comparison look better.
 Click on graph for larger image.
This graph shows light vehicle sales since 2006 from the BEA (blue) through June (red).
Vehicle sales were over 17 million SAAR in March and April as consumers rushed to "beat the tariffs".
Since then, sales have declined for two consecutive months.
The second graph shows light vehicle sales since the BEA started keeping data in 1967.
 Sales in June were below the consensus forecast of 15.5 million SAAR.
Since then, sales have declined for two consecutive months.
The second graph shows light vehicle sales since the BEA started keeping data in 1967.
 Sales in June were below the consensus forecast of 15.5 million SAAR.
ADP: Private Employment Decreased 33,000 in June
by Calculated Risk on 7/02/2025 08:46:00 AM
“Though layoffs continue to be rare, a hesitancy to hire and a reluctance to replace departing workers led to job losses last month,” said Dr. Nela Richardson, chief economist, ADP. “Still, the slowdown in hiring has yet to disrupt pay growth.”This was well below the consensus forecast of 110,000 jobs added. The BLS report will be released Thursday, and the consensus is for 129,000 non-farm payroll jobs added in June.
emphasis added
MBA: Mortgage Applications Increase in Latest MBA Weekly Survey
by Calculated Risk on 7/02/2025 07:00:00 AM
From the MBA: Mortgage Applications Increase in Latest MBA Weekly Survey
Mortgage applications increased 2.7 percent from one week earlier, according to data from the Mortgage Bankers Association’s (MBA) Weekly Mortgage Applications Survey for the week ending June 27, 2025. Last week’s results included an adjustment for the Juneteenth holiday.
The Market Composite Index, a measure of mortgage loan application volume, increased 2.7 percent on a seasonally adjusted basis from one week earlier. On an unadjusted basis, the Index increased 13 percent compared with the previous week. The Refinance Index increased 7 percent from the previous week and was 40 percent higher than the same week one year ago. The seasonally adjusted Purchase Index increased 0.1 percent from one week earlier. The unadjusted Purchase Index increased 10 percent compared with the previous week and was 16 percent higher than the same week one year ago.
“Mortgage rates were lower across all loan types last week, with the 30-year fixed rate declining to its lowest level since April at 6.79 percent. This decline prompted an increase in refinance applications, driven by a 10 percent increase in conventional applications and a 22 percent increase in VA refinance applications,” said Joel Kan, MBA’s Vice President and Deputy Chief Economist. “As borrowers with larger loans tend to be more sensitive to rate changes, the average loan size for a refinance application increased to $313,700 after averaging less than $300,000 for the past six weeks. Purchase activity was essentially flat over the week, as overall uncertainty continues to hold homebuyers out of the market. However, purchase activity still remains 16 percent higher than last year’s pace.”
...
The average contract interest rate for 30-year fixed-rate mortgages with conforming loan balances ($806,500 or less) decreased to 6.79 percent from 6.88 percent, with points decreasing to 0.62 from 0.63 (including the origination fee) for 80 percent loan-to-value ratio (LTV) loans.
emphasis added
 Click on graph for larger image.
The first graph shows the MBA mortgage purchase index.
According to the MBA, purchase activity is up 16% year-over-year unadjusted.
Red is a four-week average (blue is weekly).
Purchase application activity is still depressed, but above the lows of October 2023 and is 10% above the lowest levels during the housing bust.

The second graph shows the refinance index since 1990.
The refinance index increased but remained very low.
Tuesday, July 01, 2025
Wednesday: ADP Employment
by Calculated Risk on 7/01/2025 08:43:00 PM
 Note: Mortgage rates are from MortgageNewsDaily.com and are for top tier scenarios.
Wednesday:
• At 7:00 AM ET, The Mortgage Bankers Association (MBA) will release the results for the mortgage purchase applications index.
• At 8:15 AM, The ADP Employment Report for June. This report is for private payrolls only (no government). The consensus is for 110,000 payroll jobs added in June, up from 37,000 in May.
Cotality: House Prices Increased 1.8% YoY in May
by Calculated Risk on 7/01/2025 04:39:00 PM
From Cotality (formerly CoreLogic): US home price insights — July 2025
Spring homebuying season continues to be defined by slower price growth and tepid home buying activity.House prices are under pressure with more inventory and sluggish sales.
• Year-over-year price growth dipped to 1.8% in May 2025, down from 5% price growth last May and slowest since the winter of 2012.
• Seasonal increase in home prices continues to be weak, up 0.3% compared to the month before, and less than half of 0.8% increase typically seen between April and May
• In more affordable Midwestern markets, such as Indianapolis, Kansas City, and Knoxville, as well as markets surrounding New York metro, seasonal gains in May continued to outperform pre-pandemic trends
• Illinois, up 6.4% year-over-year entered the top 5 states with the highest home price growth, following Rhode Island, New Jersey, Wyoming and Connecticut which all continue to record more than triple the national rate of price growth
• Florida, Texas, Hawaii, and Washington D.C. reported negative home price growth.
emphasis added
Construction Spending Decreased 0.3% in May
by Calculated Risk on 7/01/2025 02:46:00 PM
From the Census Bureau reported that overall construction spending decreased:
Construction spending during May 2025 was estimated at a seasonally adjusted annual rate of $2,138.2 billion, 0.3 percent below the revised April estimate of $2,145.5 billion. The May figure is 3.5 percent below the May 2024 estimate of $2,215.4 billion.Private spending decreased and public spending increased slightly:
emphasis added
Spending on private construction was at a seasonally adjusted annual rate of $1,626.6 billion, 0.5 percent below the revised April estimate of $1,634.2 billion. ...
In May, the estimated seasonally adjusted annual rate of public construction spending was $511.6 billion, 0.1 percent above the revised April estimate of $511.3 billion.
 Click on graph for larger image.
This graph shows private residential and nonresidential construction spending, and public spending, since 1993. Note: nominal dollars, not inflation adjusted.
Private residential (red) spending is 9.2% below the peak in 2022.
Private non-residential (blue) spending is 6.8% below the peak in December 2023.
Public construction spending (orange) is slightly below the peak of October 2024.
 The second graph shows the year-over-year change in construction spending.
On a year-over-year basis, private residential construction spending is down 6.7%. Private non-residential spending is down 3.9% year-over-year. Public spending is up 3.3% year-over-year.
This was below consensus expectations and spending for the previous two months were revised down.
Fannie and Freddie: Single Family Serious Delinquency Rates Decreased in May; Fannie Multi-Family Delinquency Rate Near Highest Since Jan 2011 (ex-Pandemic)
by Calculated Risk on 7/01/2025 11:45:00 AM
Today, in the Calculated Risk Real Estate Newsletter: Fannie and Freddie: Single Family Serious Delinquency Rates Decreased in May
Excerpt:
Freddie Mac reported that the Single-Family serious delinquency rate in May was 0.55%, down from 0.57% April. Freddie's rate is up year-over-year from 0.49% in May 2024, however, this is below the pre-pandemic level of 0.60%.
Freddie's serious delinquency rate peaked in February 2010 at 4.20% following the housing bubble and peaked at 3.17% in August 2020 during the pandemic.
Fannie Mae reported that the Single-Family serious delinquency rate in May was 0.53%, down from 0.55% in April. The serious delinquency rate is up year-over-year from 0.48% in May 2024, however, this is below the pre-pandemic lows of 0.65%.
The Fannie Mae serious delinquency rate peaked in February 2010 at 5.59% following the housing bubble and peaked at 3.32% in August 2020 during the pandemic.

There is much more in the article.
BLS: Job Openings Increased to 7.8 million in May
by Calculated Risk on 7/01/2025 10:10:00 AM
From the BLS: Job Openings and Labor Turnover Summary
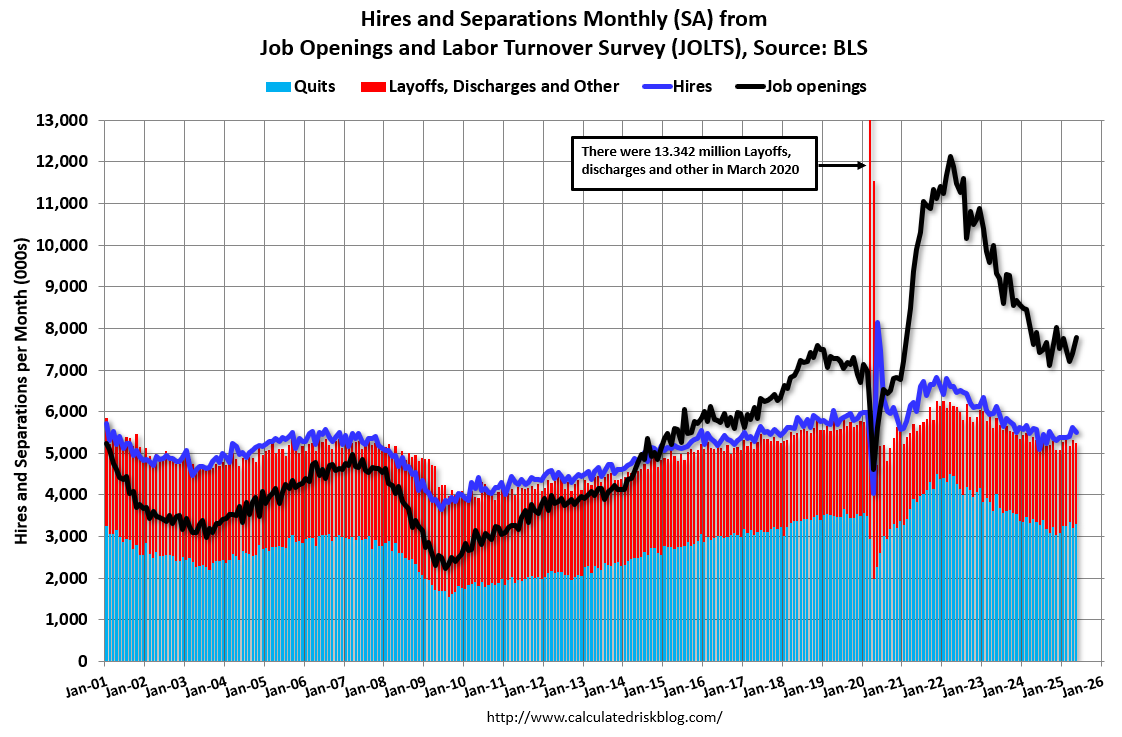
The number of job openings was little changed at 7.8 million in May, the U.S. Bureau of Labor Statistics reported today. Over the month, both hires and total separations were little changed at 5.5 million and 5.2 million, respectively. Within separations, quits (3.3 million) and layoffs and discharges (1.6 million) changed little.The following graph shows job openings (black line), hires (dark blue), Layoff, Discharges and other (red column), and Quits (light blue column) from the JOLTS.
emphasis added
This series started in December 2000.
Note: The difference between JOLTS hires and separations is similar to the CES (payroll survey) net jobs headline numbers. This report is for May; the employment report this Friday will be for June.
 Click on graph for larger image.
Note that hires (dark blue) and total separations (red and light blue columns stacked) are usually pretty close each month. This is a measure of labor market turnover. When the blue line is above the two stacked columns, the economy is adding net jobs - when it is below the columns, the economy is losing jobs.
The spike in layoffs and discharges in March 2020 is labeled, but off the chart to better show the usual data.
Jobs openings increased in May to 7.77 million from 7.40 million in April.
The number of job openings (black) were down 2% year-over-year.
Quits were down 2% year-over-year. These are voluntary separations. (See light blue columns at bottom of graph for trend for "quits").
ISM® Manufacturing index Increased to 49.0% in June
by Calculated Risk on 7/01/2025 10:00:00 AM
(Posted with permission). The ISM manufacturing index indicated expansion. The PMI® was at 49.0% in June, up from 48.5% in May. The employment index was at 45.0%, down from 46.8% the previous month, and the new orders index was at 46.2%, down from 47.6%.
From ISM: Manufacturing PMI® at 49% June 2025 Manufacturing ISM® Report On Business®
The report was issued today by Susan Spence, MBA, Chair of the Institute for Supply Management® (ISM®) Manufacturing Business Survey Committee:This suggests manufacturing contracted in June. This was slightly above the consensus forecast. New export orders were still weak; employment was weak and prices very strong.
“The Manufacturing PMI® registered 49 percent in June, a 0.5-percentage point increase compared to the 48.5 percent recorded in May. The overall economy continued in expansion for the 62nd month after one month of contraction in April 2020. (A Manufacturing PMI® above 42.3 percent, over a period of time, generally indicates an expansion of the overall economy.) The New Orders Index contracted for the fifth month in a row following a three-month period of expansion; the figure of 46.4 percent is 1.2 percentage points lower than the 47.6 percent recorded in May. The June reading of the Production Index (50.3 percent) is 4.9 percentage points higher than May’s figure of 45.4, returning the index to expansion territory. The Prices Index remained in expansion (or ‘increasing’) territory, registering 69.7 percent, up 0.3 percentage point compared to the reading of 69.4 percent reported in May. The Backlog of Orders Index registered 44.3 percent, down 2.8 percentage points compared to the 47.1 percent recorded in May. The Employment Index registered 45 percent, down 1.8 percentage points from May’s figure of 46.8 percent.
“The Supplier Deliveries Index indicated slower delivery performance, though the pace picked up somewhat: The reading of 54.2 percent is down 1.9 percentage points from the 56.1 percent recorded in May. (Supplier Deliveries is the only ISM® Report On Business® index that is inversed; a reading of above 50 percent indicates slower deliveries, which is typical as the economy improves and customer demand increases.) The Inventories Index registered 49.2 percent, up 2.5 percentage points compared to May’s reading of 46.7 percent.
“The New Export Orders Index reading of 46.3 percent is 6.2 percentage points higher than the reading of 40.1 percent registered in May. The Imports Index gained back its loss from the previous month, registering 47.4 percent, 7.5 percentage points higher than May’s reading of 39.9 percent.”
emphasis added
Monday, June 30, 2025
Tuesday: Fed Chair Powell, ISM Mfg, Construction Spending, Job Openings, Vehicle Sales
by Calculated Risk on 6/30/2025 08:16:00 PM
 From Matthew Graham at Mortgage News Daily: Mortgage Rates Take Another Step Toward April Lows
April 3rd and 4th saw the average top tier 30yr fixed mortgage rates well into the "mid 6's." Many lenders were able to quote 6.5% at the time. Just a few days ago, we noted there was still a ways to go before breaking below those early April levels, but the past few days have taken us within striking distance. [30 year fixed 6.67%]Tuesday:
emphasis added
• At 9:30 AM ET, Discussion, Fed Chair Jerome Powell, Policy Panel Discussion, At the European Central Bank Forum on Central Banking 2025, Sintra, Portugal
• At 10:00 AM, ISM Manufacturing Index for June. The consensus is for the ISM to be at 48.8, up from 48.5 in May.
• At 10:00 AM, Construction Spending for May. The consensus is for a 0.1% decrease in construction spending.
• At 10:00 AM, Job Openings and Labor Turnover Survey for May from the BLS.
• Late in the day, Light vehicle sales for June. The consensus is for light vehicle sales to be 15.5 million SAAR in June, down from 15.6 million in May (Seasonally Adjusted Annual Rate).
Trump and Fed Policy
by Calculated Risk on 6/30/2025 04:20:00 PM
Today President Trump put out a note urging Fed Chair Powell to lower rates.
The following image, courtesy of Conor Sen, shows the central bank rates around the world. Mr. Trump wrote:
Jerome, You are, as usual, "Too Late". You have cost the USA a fortune - and continue to do so - you should lower the rate - by a lot! Hundreds of billions of dollars being lost! No Inflation.
Mr. Trump also wrote "Should be here" and referenced rates between 0.25% and 1.75%. The current Fed's Fund rate is between 4.25% and 4.5%. Fed Chair Powell is probably correct about rates currently being "modestly" restrictive, but it is possible we are neutral now.
First, there is some inflation. The current rate of core PCE inflation was at 2.7% year-over-year in May, up from 2.5% in April. Core PCE inflation has slowed to 1.7% annualized over the last 3 months. Add in a 1.75% real rate - and you get close to the current Fed Funds rate.
It is difficult to predict what will happen over the next year. There is considerable uncertainty about the impact of policy on inflation and the economy in coming months.
 Click on graph for larger image.
Goldman Sachs economists noted today:
"We are pulling forward our forecast for the next cut to September. We had previously expected a cut in December because we thought that the peak summer tariff effects on monthly inflation would make it awkward to cut sooner. But the very early evidence suggests that the tariff effects look a bit smaller than we expected, other disinflationary forces have been stronger, and we suspect that the Fed leadership shares our view that tariffs will only have a one-time price level effect. And while the labor market still looks healthy, it has become hard to find a job, and both residual seasonality and immigration policy changes pose near-term downside risk to payrolls."Maybe the impact on inflation from the tariffs will be less than expected. And it seems likely the impact will be mostly transitory.
It is also possible the economic weakness from policy (immigration, fiscal) will more than offset any boost to inflation from the tariffs. Although immigration policy might push up inflation for food, etc. It is very uncertain right now.
It appears that currently Fed Funds policy is reasonably appropriate.
Freddie Mac House Price Index Declined in May; Up 2.2% Year-over-year
by Calculated Risk on 6/30/2025 01:16:00 PM
Today, in the Calculated Risk Real Estate Newsletter: Freddie Mac House Price Index Declined in May; Up 2.2% Year-over-year
A brief excerpt:
Freddie Mac reported that its “National” Home Price Index (FMHPI) decreased -0.23% month-over-month (MoM) on a seasonally adjusted (SA) basis in May. On a year-over-year (YoY) basis, the National FMHPI was up 2.2% in May, down from up 2.6% YoY in April. The YoY increase peaked at 19.0% in July 2021, and for this cycle, bottomed at up 0.9% YoY in April 2023. ...There is much more in the article!
As of May, 31 states and D.C. were below their previous peaks, Seasonally Adjusted. The largest seasonally adjusted declines from the recent peaks are in D.C. (-4.7), Colorado (-3.1%), Idaho (-3.0%), Texas (-2.7%), and Florida (-2.2%).
For cities (Core-based Statistical Areas, CBSA), 257 of the 384 CBSAs are below their previous peaks.
Here are the 30 cities with the largest declines from the peak, seasonally adjusted. Austin continues to be the worst performing city. However, 4 of the 6 cities with the largest price declines are in Florida. Cities in Florida (10) and Texas (7) dominate this list.

FHFA’s National Mortgage Database: Outstanding Mortgage Rates, LTV and Credit Scores
by Calculated Risk on 6/30/2025 09:51:00 AM
Today, in the Calculated Risk Real Estate Newsletter: FHFA’s National Mortgage Database: Outstanding Mortgage Rates, LTV and Credit Scores
A brief excerpt:
Here are some graphs on outstanding mortgages by interest rate, the average mortgage interest rate, borrowers’ credit scores and current loan-to-value (LTV) from the FHFA’s National Mortgage Database through Q1 2025 (released last Friday).There is much more in the article.
...
This shows the surge in the percent of loans under 3% starting in early 2020 as mortgage rates declined sharply during the pandemic.
Note that a fairly large percentage of mortgage loans were under 4% prior to the pandemic!
The percent of outstanding loans under 4% peaked in Q1 2022 at 65.1% (now at 53.4%), and the percent under 5% peaked at 85.6% (now at 71.3%). These low existing mortgage rates made it difficult for homeowners to sell their homes and buy a new home since their monthly payments would increase sharply.
This was a key reason existing home inventory levels were so low. However, time is eroding this lock-in effect.

Housing June 30th Weekly Update: Inventory up 0.3% Week-over-week, Up 28.7% Year-over-year
by Calculated Risk on 6/30/2025 08:11:00 AM
Altos reports that active single-family inventory was up 0.3% week-over-week.
Inventory is now up 33.1% from the seasonal bottom in January and is increasing. Usually, inventory is up about 20% from the seasonal low by this week in the year. So, 2025 is seeing a larger than normal pickup in inventory.
The first graph shows the seasonal pattern for active single-family inventory since 2015.
 Click on graph for larger image.
The red line is for 2025. The black line is for 2019.
Inventory was up 28.7% compared to the same week in 2024 (last week it was up 30.7%), and down 14.1% compared to the same week in 2019 (last week it was down 13.2%).
This is the highest level since November 2019.
For 2019, this was the week inventory peaked for the year (then moved sideways for several months), so any further increase this year will close to gap to 2019. It now appears inventory will be close to 2019 levels towards the end of 2025.
 This second inventory graph is courtesy of Altos Research.
As of June 27th, inventory was at 831 thousand (7-day average), compared to 829 thousand the prior week.
Mike Simonsen discusses this data regularly on Youtube
Sunday, June 29, 2025
Sunday Night Futures
by Calculated Risk on 6/29/2025 07:08:00 PM
Weekend:
• Schedule for Week of June 29, 2025
Monday:
• At 9:45 AM ET, Chicago Purchasing Managers Index for June.
• At 10:30 AM, Dallas Fed Survey of Manufacturing Activity for June.
From CNBC: Pre-Market Data and Bloomberg futures S&P 500 are up 17 and DOW futures are up 212 (fair value).
Oil prices were down over the last week with WTI futures at $65.52 per barrel and Brent at $67.77 per barrel. A year ago, WTI was at $83, and Brent was at $82 - so WTI oil prices are down about 21% year-over-year.
Here is a graph from Gasbuddy.com for nationwide gasoline prices. Nationally prices are at $3.17 per gallon. A year ago, prices were at $3.49 per gallon, so gasoline prices are down $0.32 year-over-year.
Hotels: Occupancy Rate Increased 1.3% Year-over-year
by Calculated Risk on 6/29/2025 08:11:00 AM
The U.S. hotel industry reported positive year-over-year comparisons, according to CoStar’s latest data through 21 June. ...The following graph shows the seasonal pattern for the hotel occupancy rate using the four-week average.
15-21 June 2025 (percentage change from comparable week in 2024):
• Occupancy: 70.5% (+1.3%)
• Average daily rate (ADR): US$163.77 (+2.0%)
• Revenue per available room (RevPAR): US$115.39 (+3.3%)
emphasis added
 Click on graph for larger image.
The red line is for 2025, blue is the median, and dashed light blue is for 2024. Dashed purple is for 2018, the record year for hotel occupancy.
The 4-week average of the occupancy rate is tracking behind both last year and the median rate for the period 2000 through 2024 (Blue).
Note: Y-axis doesn't start at zero to better show the seasonal change.
The 4-week average will increase during the summer travel season; however, we will likely see a hit to occupancy during the summer months due to less international tourism.
Saturday, June 28, 2025
Real Estate Newsletter Articles this Week: New Home Sales Decrease to 623,000 Annual Rate in May
by Calculated Risk on 6/28/2025 02:11:00 PM
At the Calculated Risk Real Estate Newsletter this week:
 Click on graph for larger image.
• New Home Sales Decrease to 623,000 Annual Rate in May
• NAR: Existing-Home Sales Increased to 4.03 million SAAR in May; Down 0.7% YoY
• Case-Shiller: National House Price Index Up 2.7% year-over-year in April
• Inflation Adjusted House Prices 1.7% Below 2022 Peak
• Final Look at Local Housing Markets in May and a Look Ahead to June Sales
This is usually published 4 to 6 times a week and provides more in-depth analysis of the housing market.
Schedule for Week of June 29, 2025
by Calculated Risk on 6/28/2025 08:11:00 AM
The key report scheduled for this week is the June employment report to be released on Thursday.
Other key reports include the June ISM Manufacturing survey, June Vehicle Sales and the Trade Deficit for May.
9:45 AM: Chicago Purchasing Managers Index for June.
10:30 AM: Dallas Fed Survey of Manufacturing Activity for June.
9:30 AM: Discussion, Fed Chair Jerome Powell, Policy Panel Discussion, At the European Central Bank Forum on Central Banking 2025, Sintra, Portugal
10:00 AM: ISM Manufacturing Index for June. The consensus is for the ISM to be at 48.8, up from 48.5 in May.
10:00 AM: Construction Spending for May. The consensus is for a 0.1% decrease in construction spending.
 10:00 AM ET: Job Openings and Labor Turnover Survey for May from the BLS.
 This graph shows job openings (black line), hires (dark blue), Layoff, Discharges and other (red column), and Quits (light blue column) from the JOLTS.
Jobs openings increased in April to 7.39 million from 7.20 million in March.
The number of job openings were down 3% year-over-year and quits were down 6% year-over-year.
 Late in the day: Light vehicle sales for June.
The consensus is for light vehicle sales to be 15.5 million SAAR in June, down from 15.6 million in May (Seasonally Adjusted Annual Rate).
This graph shows light vehicle sales since the BEA started keeping data in 1967. The dashed line is the sales rate for last month.
J.D. Power is forecasting sales of 15.0 million SAAR in June.
7:00 AM ET: The Mortgage Bankers Association (MBA) will release the results for the mortgage purchase applications index.
8:15 AM: The ADP Employment Report for June. This report is for private payrolls only (no government). The consensus is for 110,000 payroll jobs added in June, up from 37,000 in May.
 8:30 AM: Employment Report for June. The consensus is for 129,000 jobs added, and for the unemployment rate to be unchanged at 4.2%.
There were 139,000 jobs added in May, and the unemployment rate was at 4.2%.
This graph shows the jobs added per month since January 2021.
8:30 AM: The initial weekly unemployment claims report will be released. The consensus is for initial claims to increase to 239 thousand from 236 thousand last week.
 8:30 AM: Trade Balance report for May from the Census Bureau.
 This graph shows the U.S. trade deficit, with and without petroleum, through the most recent report. The blue line is the total deficit, and the black line is the petroleum deficit, and the red line is the trade deficit ex-petroleum products.
The consensus is the trade deficit to be $69.8 billion. The U.S. trade deficit was at $61.6 billion the previous month.
10:00 AM: the ISM Services Index for June. The consensus is for a reading of 50.8, up from 49.9.
All US markets will close early at 1:00 PM ET in observance of Independence Day
All US markets will be closed in observance of Independence Day
Friday, June 27, 2025
Las Vegas in May: Visitor Traffic Down 6.5% YoY; Convention Traffic up 10.7% YoY
by Calculated Risk on 6/27/2025 06:15:00 PM
From the Las Vegas Visitor Authority: May 2025 Las Vegas Visitor Statistics
With headwinds of ongoing economic uncertainty, the destination hosted approximately 3.4 million visitors in May, down ‐6.5% YoY.
Convention attendance reached approx. 511k for the month (up 10.7%), supported in part by show rotations including LightFair International (8,500 attendees), the Bitcoin conference (30k attendees) and the National Automatic Merchandising Association/NAMA Show (5k attendees). Also, a few shows were held in May this year vs. other months last year, including Las Vegas Antique Jewelry & Watch Show (7,500 attendees, held in June last year) and PETZONE360 Live (5k attendees, held in April last year.)
Hotel occupancy reached 83.0% for the month, down ‐3.1 pts with Weekend occupancy of 89.9% (down ‐3.5 pts) and Midweek occupancy of 79.3% (down ‐3.2 pts). ADR for the month reached $198 (‐2.2% YoY) with RevPAR of $165 (‐5.7% YoY).
emphasis added
 Click on graph for larger image.
 The first graph shows visitor traffic for 2019 (Black), 2020 (dark blue), 2021 (light blue), 2022 (light orange), 2023 (orange), 2024 (dark orange) and 2025 (red).
Visitor traffic was down 6.5% compared to last May. Visitor traffic was down 7.4% compared to May 2019.
Year-to-date (YTD) visitor traffic is down 6.1% compared to the same period in 2019.
 Convention traffic was up 10.7% compared to May 2024, but down 1.8% compared to May 2019.
The second graph shows convention traffic.

YTD convention traffic is down 5.7% compared to 2019.


