 RSS Feed
 by Calculated Risk on 3/22/2025 02:11:00 PM
Saturday, March 22, 2025
Real Estate Newsletter Articles this Week: Existing-Home Sales Increased to 4.26 million SAAR
At the Calculated Risk Real Estate Newsletter this week:
 Click on graph for larger image.
• NAR: Existing-Home Sales Increased to 4.26 million SAAR in February; Down 1.2% YoY
• Housing Starts Increased to 1.501 million Annual Rate in February
• Lennar: "Didn't see typical seasonal pickup after February"
• Lawler: Early Read on Existing Home Sales in February
• California Home Sales Up 2.6% YoY in February; 4th Look at Local Housing Markets
• 3rd Look at Local Housing Markets in February
This is usually published 4 to 6 times a week and provides more in-depth analysis of the housing market.
Schedule for Week of March 23, 2025
by Calculated Risk on 3/22/2025 08:11:00 AM
The key reports scheduled for this week include February New Home sales, the 3rd estimate of Q4 GDP, February Personal Income & Outlays, and January Case-Shiller house prices.
For manufacturing, the March Richmond and Kansas City Fed surveys will be released.
8:30 AM ET: Chicago Fed National Activity Index for February. This is a composite index of other data.
 9:00 AM: S&P/Case-Shiller House Price Index for January.
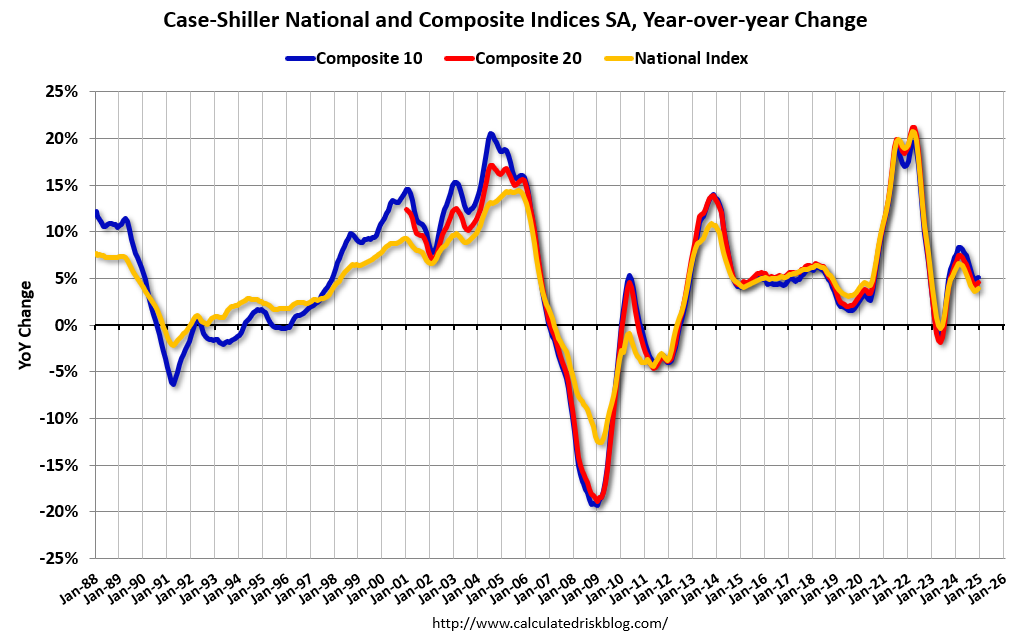
This graph shows the year-over-year change for the Case-Shiller National, Composite 10 and Composite 20 indexes, through the most recent report (the Composite 20 was started in January 2000).
The consensus is for a 4.6% year-over-year increase in the 20-city index for January, up from 4.5% YoY in December.
9:00 AM: FHFA House Price Index for January. This was originally a GSE only repeat sales, however there is also an expanded index.
 10:00 AM: New Home Sales for February from the Census Bureau.
 This graph shows New Home Sales since 1963. The dashed line is the sales rate for last month.
The consensus is for 680 thousand SAAR, up from 657 thousand in January.
10:00 AM: Richmond Fed Survey of Manufacturing Activity for March.
7:00 AM ET: The Mortgage Bankers Association (MBA) will release the results for the mortgage purchase applications index.
8:30 AM: Durable Goods Orders for February from the Census Bureau. The consensus is for a 0.7% decrease in durable goods orders.
8:30 AM: The initial weekly unemployment claims report will be released. The consensus is for 225 initial claims up from 223 thousand last week.
8:30 AM, Gross Domestic Product, 4th Quarter and Year 2024 (Third Estimate), GDP by Industry, and Corporate Profits. The consensus is that real GDP increased 2.3% annualized in Q4, unchanged from 2.3% in the second estimate.
10:00 AM: Pending Home Sales Index for February.
11:00 AM: the Kansas City Fed manufacturing survey for March.
8:30 AM: Personal Income and Outlays for February. The consensus is for a 0.4% increase in personal income, and for a 0.6% increase in personal spending. And for the Core PCE price index to increase 0.3%. PCE prices are expected to be up 2.5% YoY, and core PCE prices up 2.7% YoY.
10:00 AM: University of Michigan's Consumer sentiment index (Final for March). The consensus is for a reading of 57.9.
10:00 AM: State Employment and Unemployment (Monthly) for February 2025
Friday, March 21, 2025
March 21st COVID Update: COVID Deaths Continue Declining
by Calculated Risk on 3/21/2025 07:28:00 PM
 Note: Mortgage rates are from MortgageNewsDaily.com and are for top tier scenarios.
For deaths, I'm currently using 4 weeks ago for "now", since the most recent three weeks will be revised significantly.
Note: "Effective May 1, 2024, hospitals are no longer required to report COVID-19 hospital admissions, hospital capacity, or hospital occupancy data." So, I'm no longer tracking hospitalizations.
| COVID Metrics | ||||
|---|---|---|---|---|
| Now | Week Ago | Goal | ||
| Deaths per Week | 635 | 692 | ≤3501 | |
| 1my goals to stop weekly posts. 🚩 Increasing number weekly for Deaths. ✅ Goal met. | ||||
 Click on graph for larger image.
This graph shows the weekly (columns) number of deaths reported since Jan 2023.
Although weekly deaths met the original goal to stop posting in June 2023 (low of 314 deaths), I've continued to post since deaths are above the goal again - and I'll continue to post until weekly deaths are once again below the goal.
Weekly deaths are now decreasing following the winter pickup and only double the low last year.
 This appears to be a leading indicator for COVID hospitalizations and deaths. This has mostly moved sideways nationally over the last several weeks. This measure has ticked up in the South and Midwest regions.
Nationally COVID in wastewater is "Moderate", up from "Low" last week according to the CDC.
Lennar: "Didn't see typical seasonal pickup after February"
by Calculated Risk on 3/21/2025 02:31:00 PM
Today, in the CalculatedRisk Real Estate Newsletter: Lennar: "Didn't see typical seasonal pickup after February"
Full text:
This is a short note …
The Lennar headline is from a comment this morning. This is just one anecdote, but I believe the housing market will be impacted by policy.
I started the year taking Fed Chair Jerome Powell’s approach to the impact of policy: I’d wait to see what was implemented before changing my outlook. Here is my outlook at the start of 2025:
How much will Residential investment change in 2025? How about housing starts and new home sales in 2025?
What will happen with house prices in 2025?
Will inventory increase further in 2025?
Next week I’ll update my outlook for housing starts, home sales, house prices and more based on the policy changes.
Hotels: Occupancy Rate Decreased 3.5% Year-over-year
by Calculated Risk on 3/21/2025 01:07:00 PM
From the WaPo: Nervous about Trump, international tourists scrap their U.S. travel plans
International travel to the United States is expected to slide by 5 percent this year, contributing to a $64 billion shortfall for the travel industry, according to Tourism Economics. The research firm had originally forecast a 9 percent increase in foreign travel, but revised its estimate late last month to reflect “polarizing Trump Administration policies and rhetoric.”
“There’s been a dramatic shift in our outlook,” said Adam Sacks, president of Tourism Economics. “You’re looking at a much weaker economic engine than what otherwise would’ve been, not just because of tariffs, but the rhetoric and condescending tone around it.”
And Germany and the UK have issued (mild) warnings on travel to U.S.
1) Canada 31% in 2023
2) Mexico 22% in 2023
3) UK 6% in 2023
This could impact hotel occupancy in the U.S.
The U.S. hotel industry reported negative year-over-year comparisons, according to CoStar’s latest data through 15 March. ...The following graph shows the seasonal pattern for the hotel occupancy rate using the four-week average.
9-15 March 2025 (percentage change from comparable week in 2024):
• Occupancy: 64.2% (-3.5%)
• Average daily rate (ADR): US$162.49 (-0.7%)
• Revenue per available room (RevPAR): US$104.36 (-4.2%)
emphasis added
 Click on graph for larger image.
The red line is for 2025, blue is the median, and dashed light blue is for 2024. Dashed purple is for 2018, the record year for hotel occupancy.
The 4-week average of the occupancy rate is tracking below last year and is lower than the median rate for the period 2000 through 2024 (Blue).
Note: Y-axis doesn't start at zero to better show the seasonal change.
The 4-week average will increase a little more seasonally and then move sideways until the summer travel season. We might see a hit to occupancy during the summer months due to less international tourism.
Q1 GDP Tracking: Wide Range
by Calculated Risk on 3/21/2025 10:15:00 AM
NOTE: An update to the gold adjusted GDPNow will be released on March 26th. Based on the previous adjustment, it appears GDPNow (adjusted) is slightly positive for Q1. (For more on the gold adjustment, see For GDP Forecasters, Some Gold Doesn't Glitter
From BofA:
Our 1Q GDP tracking remains unchanged at 1.9% q/q saar and our 4Q GDP tracking also remained at 2.3% q/q saar since our last weekly publication. [Mar 21st estimate]From Goldman:
emphasis added
We left our Q1 GDP tracking and domestic final sales estimates unchanged at +1.3% (quarter-over-quarter annualized) and +2.0%, respectively. [Mar 20th estimate]
 And from the Atlanta Fed: GDPNow
The GDPNow model estimate for real GDP growth (seasonally adjusted annual rate) in the first quarter of 2025 is -1.8 percent on March 18, up from -2.1 percent on March 17. After this morning’s releases from the US Census Bureau, the US Bureau of Labor Statistics, and the Federal Reserve Board of Governors, the nowcast for first-quarter real gross private domestic investment growth increased from 7.2 percent to 9.1 percent. Due to FOMC blackout policy, today’s post does not include an update of the version of the model described here that adjusts the standard GDPNow model forecast for foreign trade in gold. That adjusted model will again be updated after our first scheduled post-blackout update on March 26. [Mar 18th estimate]
Intercontinental Exchange: Mortgage Delinquency Rate Increased in February
by Calculated Risk on 3/21/2025 08:11:00 AM
• The national delinquency rate edged up 5 basis points (bps) to 3.53% in February; that’s up 19 bps from a year ago but still 32 bps below where it was entering the pandemic
• FHA mortgages accounted for 90% of the 131K rise in the number of delinquencies, despite making up less than 15% of all active mortgages
• 4,100 homeowners in Los Angeles are now past due as a result of the wildfires, up from 700 in January, with daily performance data suggesting that number could edge higher in March
• Foreclosure starts (-17%) and sales (-11%) eased in February, but are up (+34%/+7%) from the same time last year as VA foreclosure activity resumed after a year-long moratorium
• Prepayment activity (SMM) fell to 0.46% in February, the lowest level in a year, on higher rates and a seasonal dip in home sales
emphasis added
 Click on graph for larger image.
Here is a table from ICE.
Thursday, March 20, 2025
Realtor.com Reports Active Inventory Up 28.5% YoY
by Calculated Risk on 3/20/2025 01:47:00 PM
What this means: On a weekly basis, Realtor.com reports the year-over-year change in active inventory and new listings. On a monthly basis, they report total inventory. For February, Realtor.com reported inventory was up 27.5% YoY, but still down 22.9% compared to the 2017 to 2019 same month levels.
Now - on a weekly basis - inventory is up 28.5% YoY.
Realtor.com has monthly and weekly data on the existing home market. Here is their weekly report: Weekly Housing Trends View—Data for Week Ending March 15, 2025 Here is a graph of the year-over-year change in inventory according to realtor.com.
Inventory was up year-over-year for the 71st consecutive week.
Realtor.com has monthly and weekly data on the existing home market. Here is their weekly report: Weekly Housing Trends View—Data for Week Ending March 15, 2025
• Active inventory increased, with for-sale homes 28.5% above year-ago levels
The number of homes for sale has now been higher than the previous year for 71 consecutive weeks. This continued rise in active inventory is in part due to less active buyers. With more choices available, buyers can afford to be more selective, putting pressure on sellers to price competitively.
• New listings—a measure of sellers putting homes up for sale—increased 10.4%
Newly listed inventory grew for the 10th consecutive week, signaling that sellers are gaining confidence in listing their homes despite persistently high mortgage rates. This week’s annual growth picked up compared with last week.
• The median list price was flat year over year
This marks the 42nd consecutive week that the national median home list price has either remained steady or declined compared with the same week last year. Importantly, the annual difference narrowed for the third consecutive week and prices measured flat year over year for the first time since last fall. Controlling for the size of the home, the median list price per square foot increased by 1.3% annually, suggesting there are more smaller homes on the market compared with last year. The share of homes with a price reduction increased by 0.8% this week, pointing to more seller adjustments in light of growing inventory and a slowing market pace.
 Here is a graph of the year-over-year change in inventory according to realtor.com.
 Inventory was up year-over-year for the 71st consecutive week.
New listings have increased recently but remain below typical pre-pandemic levels.
Median prices are mostly unchanged year-over-year.
Newsletter: NAR: Existing-Home Sales Increased to 4.26 million SAAR in February
by Calculated Risk on 3/20/2025 10:51:00 AM
Today, in the CalculatedRisk Real Estate Newsletter: NAR: Existing-Home Sales Increased to 4.26 million SAAR in February; Down 1.2% YoY
Excerpt:
Sales in February (4.26 million SAAR) were up 4.2% from the previous month and were 1.2% below the February 2024 sales rate. This breaks the streak of fourth consecutive year-over-year increases in sales.There is much more in the article.
...
Sales Year-over-Year and Not Seasonally Adjusted (NSA)
The fourth graph shows existing home sales by month for 2024 and 2025.
Sales decreased 1.2% year-over-year compared to February 2024.

NAR: Existing-Home Sales Increased to 4.26 million SAAR in February; Down 1.2% YoY
by Calculated Risk on 3/20/2025 10:00:00 AM
From the NAR: Existing-Home Sales Accelerated 4.2% in February
Existing-home sales ascended in February, according to the National Association of REALTORS®. For both monthly and year-over-year sales, two major U.S. regions experienced growth, one region remained stable and the other registered a decline.
Total existing-home sales – completed transactions that include single-family homes, townhomes, condominiums and co-ops – progressed 4.2% from January to a seasonally adjusted annual rate of 4.26 million in February. Year-over-year, sales slid 1.2% (down from 4.31 million in February 2024).
...
Total housing inventory registered at the end of February was 1.24 million units, up 5.1% from January and 17% from one year ago (1.06 million). Unsold inventory sits at a 3.5-month supply at the current sales pace, identical to January and up from 3.0 months in February 2024.
emphasis added
Click on graph for larger image.This graph shows existing home sales, on a Seasonally Adjusted Annual Rate (SAAR) basis since 1994.
Sales in February (4.26 million SAAR) were up 4.2% from the previous month and were 1.2% below the February 2024 sales rate. This breaks the streak of fourth consecutive year-over-year increases in sales.
The second graph shows nationwide inventory for existing homes.
 According to the NAR, inventory increased to 1.24 million in February from 1.18 million the previous month.
 According to the NAR, inventory increased to 1.24 million in February from 1.18 million the previous month.
Headline inventory is not seasonally adjusted, and inventory usually decreases to the seasonal lows in December and January, and peaks in mid-to-late summer.
The last graph shows the year-over-year (YoY) change in reported existing home inventory and months-of-supply. Since inventory is not seasonally adjusted, it really helps to look at the YoY change. Note: Months-of-supply is based on the seasonally adjusted sales and not seasonally adjusted inventory.
 Inventory was up 17.0% year-over-year (blue) in February compared to February 2024.
Months of supply (red) was unchanged at 3.5 months in February from 3.5 months the previous month.
As expected, the sales rate was above the consensus forecast. I'll have more later.
The last graph shows the year-over-year (YoY) change in reported existing home inventory and months-of-supply. Since inventory is not seasonally adjusted, it really helps to look at the YoY change. Note: Months-of-supply is based on the seasonally adjusted sales and not seasonally adjusted inventory.
 Inventory was up 17.0% year-over-year (blue) in February compared to February 2024.
 Months of supply (red) was unchanged at 3.5 months in February from 3.5 months the previous month.
As expected, the sales rate was above the consensus forecast. I'll have more later.
Weekly Initial Unemployment Claims Increase to 223,000
by Calculated Risk on 3/20/2025 08:30:00 AM
The DOL reported:
In the week ending March 15, the advance figure for seasonally adjusted initial claims was 223,000, an increase of 2,000 from the previous week's revised level. The previous week's level was revised up by 1,000 from 220,000 to 221,000. The 4-week moving average was 227,000, an increase of 750 from the previous week's revised average. The previous week's average was revised up by 250 from 226,000 to 226,250.The following graph shows the 4-week moving average of weekly claims since 1971.
emphasis added
 Click on graph for larger image.
The dashed line on the graph is the current 4-week average. The four-week average of weekly unemployment claims increased to 227,000.
The previous week was revised up.
Weekly claims were close to the consensus forecast.
Wednesday, March 19, 2025
Thursday: Unemployment Claims, Philly Fed Mfg, Existing Home Sales
by Calculated Risk on 3/19/2025 07:43:00 PM
 Note: Mortgage rates are from MortgageNewsDaily.com and are for top tier scenarios.
Thursday:
• At 8:30 AM ET, The initial weekly unemployment claims report will be released. The consensus is for 224 initial claims up from 220 thousand last week.
• Also at 8:30 AM, the Philly Fed manufacturing survey for March. The consensus is for a reading of 12.0, down from 18.0.
• At 10:00 AM, Existing Home Sales for February from the National Association of Realtors (NAR). The consensus is for 3.92 million SAAR, down from 4.08 million. Housing economist Tom Lawler expects the NAR to report sales of 4.21 million SAAR for January.
LA Ports: February Inbound Traffic Up YoY, Outbound Down
by Calculated Risk on 3/19/2025 04:26:00 PM
Container traffic gives us an idea about the volume of goods being exported and imported - and usually some hints about the trade report since LA area ports handle about 40% of the nation's container port traffic.
The following graphs are for inbound and outbound traffic at the ports of Los Angeles and Long Beach in TEUs (TEUs: 20-foot equivalent units or 20-foot-long cargo container).
To remove the strong seasonal component for inbound traffic, the first graph shows the rolling 12-month average.
 Click on graph for larger image.
On a rolling 12-month basis, inbound traffic increased 0.4% in February compared to the rolling 12 months ending in December. Outbound traffic decreased 0.8% compared to the rolling 12 months ending the previous month.
The 2nd graph is the monthly data (with a strong seasonal pattern for imports).
 Usually imports peak in the July to October period as retailers import goods for the Christmas holiday and then decline sharply and bottom in the Winter depending on the timing of the Chinese New Year.
 Usually imports peak in the July to October period as retailers import goods for the Christmas holiday and then decline sharply and bottom in the Winter depending on the timing of the Chinese New Year.
 Imports were up 6% YoY in February and exports were down 10% YoY.
This was a very strong July through January period for imports - up about 27% YoY - as importers rushed to beat the tariffs. That has started to slow.
FOMC Projections: GDP Revised Down, Inflation Revised Up
by Calculated Risk on 3/19/2025 03:13:00 PM
Statement here.
Fed Chair Powell press conference video here or on YouTube here, starting at 2:30 PM ET.
Here are the projections.
In December, the FOMC participants’ midpoint of the target level for the federal funds rate was around 3.875% at the end of 2025 (3.6%-4.1%) and the long run range was 2.8% to 3.6%. The FOMC participants’ midpoint of the target range is now at 4.0% at the end of 2025 (3.9%-4.4%) and the long run range is 2.6% to 3.6%.
It appears growth slower than expected in Q1 2025, and 2025 GDP growth was revised down.
| GDP projections of Federal Reserve Governors and Reserve Bank presidents, Change in Real GDP1 | ||||
|---|---|---|---|---|
| Projection Date | 2025 | 2026 | 2027 | |
| Mar 2025 | 1.5 to 1.9 | 1.6 to 1.9 | 1.6 to 2.0 | |
| Dec 2024 | 1.8 to 2.2 | 1.9 to 2.1 | 1.8 to 2.0 | |
The unemployment rate was at 4.1% in February.
| Unemployment projections of Federal Reserve Governors and Reserve Bank presidents, Unemployment Rate2 | ||||
|---|---|---|---|---|
| Projection Date | 2025 | 2026 | 2027 | |
| Mar 2025 | 4.3 to 4.4 | 4.2 to 4.5 | 4.1 to 4.4 | |
| Dec 2024 | 4.2 to 4.5 | 4.1 to 4.4 | 4.0 to 4.4 | |
As of January 2025, PCE inflation increased 2.5 percent year-over-year (YoY). The projections for Q4 2025 PCE inflation were revised up.
| Inflation projections of Federal Reserve Governors and Reserve Bank presidents, PCE Inflation1 | ||||
|---|---|---|---|---|
| Projection Date | 2025 | 2026 | 2027 | |
| Mar 2025 | 2.6 to 2.9 | 2.1 to 2.3 | 2.0 to 2.1 | |
| Dec 2024 | 2.3 to 2.6 | 2.0-2.2 | 2.0 | |
PCE core inflation increased 2.6 percent YoY in January and is expected to be up 2.7 percent YoY in February. The projections for core PCE inflation Q4 2025 were revised up.
| Core Inflation projections of Federal Reserve Governors and Reserve Bank presidents, Core Inflation1 | ||||
|---|---|---|---|---|
| Projection Date | 2025 | 2026 | 2027 | |
| Mar 2025 | 2.7 to 3.0 | 2.1 to 2.4 | 2.0 to 2.1 | |
| Dec 2024 | 2.5 to 2.7 | 2.0-2.3 | 2.0 | |
FOMC Statement: No Change to Fed Funds Rate; "Uncertainty Increased"
by Calculated Risk on 3/19/2025 02:00:00 PM
Fed Chair Powell press conference video here or on YouTube here, starting at 2:30 PM ET.
FOMC Statement:
Recent indicators suggest that economic activity has continued to expand at a solid pace. The unemployment rate has stabilized at a low level in recent months, and labor market conditions remain solid. Inflation remains somewhat elevated.
The Committee seeks to achieve maximum employment and inflation at the rate of 2 percent over the longer run. Uncertainty around the economic outlook has increased. The Committee is attentive to the risks to both sides of its dual mandate.
In support of its goals, the Committee decided to maintain the target range for the federal funds rate at 4-1/4 to 4-1/2 percent. In considering the extent and timing of additional adjustments to the target range for the federal funds rate, the Committee will carefully assess incoming data, the evolving outlook, and the balance of risks. The Committee will continue reducing its holdings of Treasury securities and agency debt and agency mortgage‑backed securities. Beginning in April, the Committee will slow the pace of decline of its securities holdings by reducing the monthly redemption cap on Treasury securities from $25 billion to $5 billion. The Committee will maintain the monthly redemption cap on agency debt and agency mortgage-backed securities at $35 billion. The Committee is strongly committed to supporting maximum employment and returning inflation to its 2 percent objective.
In assessing the appropriate stance of monetary policy, the Committee will continue to monitor the implications of incoming information for the economic outlook. The Committee would be prepared to adjust the stance of monetary policy as appropriate if risks emerge that could impede the attainment of the Committee's goals. The Committee's assessments will take into account a wide range of information, including readings on labor market conditions, inflation pressures and inflation expectations, and financial and international developments.
Voting for the monetary policy action were Jerome H. Powell, Chair; John C. Williams, Vice Chair; Michael S. Barr; Michelle W. Bowman; Susan M. Collins; Lisa D. Cook; Austan D. Goolsbee; Philip N. Jefferson; Adriana D. Kugler; Alberto G. Musalem; and Jeffrey R. Schmid. Voting against this action was Christopher J. Waller, who supported no change for the federal funds target range but preferred to continue the current pace of decline in securities holdings.
emphasis added
AIA: "Billings remain soft at architecture firms as interest in new projects wanes"
by Calculated Risk on 3/19/2025 12:58:00 PM
Note: This index is a leading indicator primarily for new Commercial Real Estate (CRE) investment.
From the AIA: ABI February 2025: Billings remain soft at architecture firms as interest in new projects wanes
The AIA/Deltek Architecture Billings Index (ABI) score was 45.5 for the month, indicating that a majority of firms are still experiencing declining firm billings. Billings were flat early in the fourth quarter of 2024 but have softened significantly since then. February also marked the first month since the height of the pandemic in 2020 that inquiries into new projects at firms have declined. Inquiries can be as formal as an RFP or RFQ from a potential client, or as informal as a discussion about a potential project, and rarely decline, even during periods of economic softness. The decline this month likely reflects the ongoing uncertainty about the economy at this time. In addition, the value of new signed design contracts decreased at firms for the twelfth consecutive month in February, as clients also remain hesitant to commit to new projects at this time.• Northeast (41.3); Midwest (45.2); South (47.6); West (48.1)
Billings remained soft in all regions of the country in February as well. While firms located in the West reported modest growth throughout the fourth quarter of 2024, business conditions there have softened somewhat since then. Billings remained weakest at firms located in the Northeast, with more moderate declines in billings reported at firms located in the Midwest and South. Business conditions were also weak across firms of all specializations this month, remaining softest at firms with a multifamily residential specialization for the second consecutive month.
...
The ABI score is a leading economic indicator of construction activity, providing an approximately nine-to-twelve-month glimpse into the future of nonresidential construction spending activity. The score is derived from a monthly survey of architecture firms that measures the change in the number of services provided to clients.
emphasis added
• Sector index breakdown: commercial/industrial (46.9); institutional (46.4); multifamily residential (46.1)
 Click on graph for larger image.
This graph shows the Architecture Billings Index since 1996. The index was at 45.5 in February, down from 45.6 in January. Anything below 50 indicates a decrease in demand for architects' services.
This index has indicated contraction for 27 of the last 29 months.
Note: This includes commercial and industrial facilities like hotels and office buildings, multi-family residential, as well as schools, hospitals and other institutions.
This index usually leads CRE investment by 9 to 12 months, so this index suggests a slowdown in CRE investment in 2025.
Note: This includes commercial and industrial facilities like hotels and office buildings, multi-family residential, as well as schools, hospitals and other institutions.
This index usually leads CRE investment by 9 to 12 months, so this index suggests a slowdown in CRE investment in 2025.
Multi-family billings remained negative has been negative for the last 31 months. This suggests we will see further weakness in multi-family starts.
California Home Sales Up 2.6% YoY in February; 4th Look at Local Housing Markets
by Calculated Risk on 3/19/2025 09:23:00 AM
Today, in the Calculated Risk Real Estate Newsletter: California Home Sales Up 2.6% YoY in February; 4th Look at Local Housing Markets
A brief excerpt:
Here are a few more local markets prior to the NAR release tomorrow.There is much more in the article.
The NAR is scheduled to release February Existing Home sales on Thursday, March 20th at 10:00 AM. The consensus is for 3.92 million SAAR, down from 4.08 million in January. Last year, the NAR reported sales in February 2024 at 4.31 million SAAR.
Housing economist Tom Lawler expects the NAR to report sales of 4.21 million SAAR for January. The consensus appears to be too low - take the over!!!
...
From the California Association of Realtors® (C.A.R.): California housing market rebounds in February with highest home sales in more than two years, C.A.R. reportsFebruary’s sales pace surged 11.6 percent from the 254,110 homes sold in January and was up 2.6 percent from a year ago, when a revised 276,280 homes were sold on an annualized basis. The February sales level was the highest since October 2022. Although home sales have rebounded strongly, they have remained below the 300,000 mark since September 2022....
Several local markets - like Illinois, Miami, New Jersey and New York - will report after the NAR release.
MBA: Mortgage Applications Decrease in Latest MBA Weekly Survey
by Calculated Risk on 3/19/2025 07:00:00 AM
From the MBA: Mortgage Applications Decrease in Latest MBA Weekly Survey
Mortgage applications decreased 6.2 percent from one week earlier, according to data from the Mortgage Bankers Association’s (MBA) Weekly Mortgage Applications Survey for the week ending March 14, 2025.
The Market Composite Index, a measure of mortgage loan application volume, decreased 6.2 percent on a seasonally adjusted basis from one week earlier. On an unadjusted basis, the Index decreased 6 percent compared with the previous week. The Refinance Index decreased 13 percent from the previous week and was 70 percent higher than the same week one year ago. The seasonally adjusted Purchase Index increased 0.1 percent from one week earlier. The unadjusted Purchase Index increased 1 percent compared with the previous week and was 6 percent higher than the same week one year ago.
“Mortgage rates increased for the first time in nine weeks, with the 30-year fixed rate rising to 6.72 percent. This increase in rates led to a decrease in refinance volume. However, purchase application volume inched up to its highest level in six weeks, led by a 3 percent increase in FHA purchase applications,” said Mike Fratantoni, MBA’s SVP and Chief Economist. “Overall, purchase application volume is up 6 percent compared to last year at this time. Growing inventories of homes on the market and steadier mortgage rates are supporting homebuying activity thus far this spring.”
...
The average contract interest rate for 30-year fixed-rate mortgages with conforming loan balances ($806,500 or less) decreased to 6.67 percent from 6.73 percent, with points increasing to 0.63 from 0.60 (including the origination fee) for 80 percent loan-to-value ratio (LTV) loans.
emphasis added
 Click on graph for larger image.
The first graph shows the MBA mortgage purchase index.
According to the MBA, purchase activity is up 6% year-over-year unadjusted.
Red is a four-week average (blue is weekly).
Purchase application activity is up about 23% from the lows in late October 2023 and is only 2% above the lowest levels during the housing bust.

The second graph shows the refinance index since 1990.
The refinance index declined after increasing sharply the previous two weeks and remains very low.
Tuesday, March 18, 2025
Wednesday: FOMC Statement
by Calculated Risk on 3/18/2025 07:38:00 PM
 Note: Mortgage rates are from MortgageNewsDaily.com and are for top tier scenarios.
Wednesday:
• At 7:00 AM ET: The Mortgage Bankers Association (MBA) will release the results for the mortgage purchase applications index.
• During the day: The AIA's Architecture Billings Index for February (a leading indicator for commercial real estate).
• At 2:00 PM: FOMC Meeting Announcement. No change to policy is expected at this meeting.
• At 2:00 PM: FOMC Projections. This will include the Federal Open Market Committee (FOMC) participants' projections of the appropriate target federal funds rate along with updated economic projections.
• At 2:30 PM: Fed Chair Jerome Powell holds a press briefing following the FOMC announcement.
Las Vegas in January: Visitor Traffic Down 1.1% YoY; Convention Traffic Up YoY
by Calculated Risk on 3/18/2025 02:58:00 PM
From the Las Vegas Visitor Authority: January 2025 Las Vegas Visitor Statistics
Las Vegas started the year with January visitation of approx. 3.34M visitors, down 1.1% from last January.
Las Vegas convention attendance reached roughly 629k in January, up 12.8% YoY, supported in part by strong attendance at recurring larger tradeshows including CES and World of Concrete, plus the calendar impact of World Market Center's Winter show (38k attendees) and Total Product Expo (8k attendees) falling fully in January this year vs. last year when its impact straddled Jan and Feb.
On a room base with roughly 6k fewer rooms than last year, occupancy reached 81.9%, up 3.0 pts with Weekend occupancy of 85.6% (up 2.0 pts) and Midweek occupancy of 80.2% (up 3.2 pts.) ADR for the month reached $195 (+2.2% YoY) with RevPAR of $160 (+6.0% YoY).
emphasis added
 Click on graph for larger image.
 The first graph shows visitor traffic for 2019 (Black), 2020 (dark blue), 2021 (light blue), 2022 (light orange), 2023 (orange), 2024 (dark orange) and 2025 (red).
Visitor traffic was down 1.1% compared to last January. Visitor traffic was down 2.0% compared to January 2019.
The second graph shows convention traffic.


