 RSS Feed
 by Calculated Risk on 11/03/2024 08:19:00 PM
Sunday, November 03, 2024
Sunday Night Futures
Weekend:
• Schedule for Week of November 3, 2024
Monday:
• No major economic releases scheduled.
From CNBC: Pre-Market Data and Bloomberg futures S&P 500 are down 8 and DOW futures are down 168 (fair value).
Oil prices were down over the last week with WTI futures at $69.49 per barrel and Brent at $71.10 per barrel. A year ago, WTI was at $81, and Brent was at $88 - so WTI oil prices are down about 14% year-over-year.
Here is a graph from Gasbuddy.com for nationwide gasoline prices. Nationally prices are at $3.06 per gallon. A year ago, prices were at $3.40 per gallon, so gasoline prices are down $0.34 year-over-year.
FOMC Preview: Fed to Cut Rates 25bp
by Calculated Risk on 11/03/2024 09:59:00 AM
Most analysts expect the FOMC will cut the federal funds rate at the meeting this week by 25bp lowering the target range to 4 1/2 to 4 3/4 percent.
Currently almost all market participants are expecting a 25bp cut this week. Market participants are also pricing in another 25bp cut in December.
From BofA:
We expect the Fed to cut rates by 25bp in November. ... Chair Powell’s message in the press conference should remain optimistic, particularly given the recent robust data flow. Powell is likely to emphasize data dependence once again, and provide little forward guidance about the policy path.From Goldman:
emphasis added
We continue to expect the FOMC to lower the fed funds rate by 25bp at the November and December meetings.
Projections will NOT be released at this meeting. For review, here are the September projections.
The FOMC will look through the employment report released Friday because of the impact of hurricanes and the Boeing strike on job gains in October.
The BEA's second estimate for Q3 GDP showed real growth at 2.8% annualized, following 3.0% annualized real growth in Q2, and 1.6% in Q1. Current estimates for Q4 GDP are around 2.6%. That would put real growth in 2024, Q4 over Q4, at 2.5% - well above the top end of the September FOMC projections.
| GDP projections of Federal Reserve Governors and Reserve Bank presidents, Change in Real GDP1 | ||||
|---|---|---|---|---|
| Projection Date | 2024 | 2025 | 2026 | 2027 |
| Sept 2024 | 1.9 to 2.1 | 1.8 to 2.2 | 1.9 to 2.3 | 1.8 to 2.1 |
| June 2024 | 1.9 to 2.3 | 1.8 to 2.2 | 1.8 to 2.1 | --- |
The unemployment rate was at 4.1% in October. This is below the low end of the September projections.
| Unemployment projections of Federal Reserve Governors and Reserve Bank presidents, Unemployment Rate2 | ||||
|---|---|---|---|---|
| Projection Date | 2024 | 2025 | 2026 | 2027 |
| Sept 2024 | 4.3 to 4.4 | 4.2 to 4.5 | 4.0 to 4.4 | 4.0 to 4.4 |
| June 2024 | 3.9 to 4.2 | 3.9 to 4.3 | 3.9 to 4.3 | --- |
As of September 2024, PCE inflation increased 2.1 percent year-over-year (YoY). This is below the low end of the September projections.
| Inflation projections of Federal Reserve Governors and Reserve Bank presidents, PCE Inflation1 | ||||
|---|---|---|---|---|
| Projection Date | 2024 | 2025 | 2026 | 2027 |
| Sept 2024 | 2.2 to 2.4 | 2.1 to 2.2 | 2.0 | 2.0 |
| June 2024 | 2.5 to 2.9 | 2.2 to 2.4 | 2.0 to 2.1 | --- |
PCE core inflation increased 2.7 percent YoY in September. This is in the range of FOMC projections for Q4.
| Core Inflation projections of Federal Reserve Governors and Reserve Bank presidents, Core Inflation1 | ||||
|---|---|---|---|---|
| Projection Date | 2024 | 2025 | 2026 | 2027 |
| Sept 2024 | 2.6 to 2.7 | 2.1 to 2.3 | 2.0 | 2.0 |
| June 2024 | 2.8 to 3.0 | 2.3 to 2.4 | 2.0 to 2.1 | --- |
November 1st COVID Update: Wastewater Measure Continues to Decline
by Calculated Risk on 11/03/2024 07:11:00 AM
 Note: Mortgage rates are from MortgageNewsDaily.com and are for top tier scenarios.
For deaths, I'm currently using 4 weeks ago for "now", since the most recent three weeks will be revised significantly.
Note: "Effective May 1, 2024, hospitals are no longer required to report COVID-19 hospital admissions, hospital capacity, or hospital occupancy data." So I'm no longer tracking hospitalizations.
| COVID Metrics | ||||
|---|---|---|---|---|
| Now | Week Ago | Goal | ||
| Deaths per Week | 905 | 985 | ≤3501 | |
| 1my goals to stop weekly posts, 🚩 Increasing number weekly for Deaths ✅ Goal met. | ||||
 Click on graph for larger image.
This graph shows the weekly (columns) number of deaths reported.
Although weekly deaths met the original goal to stop posting, I'm continuing to post now that deaths are above the goal again.
Weekly deaths are triple the low of 302 in early June but are now declining and will likely continue to decline based on wastewater sampling.
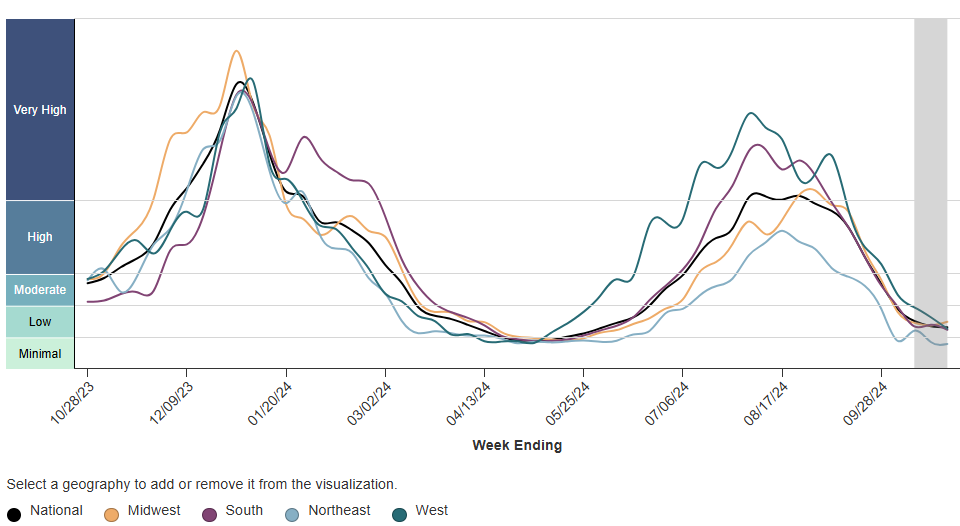 This appears to be a leading indicator for COVID hospitalizations and deaths.
COVID in wastewater is declining - only about 50% higher than the lows of last May - suggesting weekly deaths will continue to decline.
Saturday, November 02, 2024
Real Estate Newsletter Articles this Week: Case-Shiller: National House Price Index Up 4.2% year-over-year in August
by Calculated Risk on 11/02/2024 02:11:00 PM
At the Calculated Risk Real Estate Newsletter this week:
 Click on graph for larger image.
• Case-Shiller: National House Price Index Up 4.2% year-over-year in August
• Fannie and Freddie: Single Family and Multi-Family Serious Delinquency Rates Increased in September
• Inflation Adjusted House Prices 1.5% Below 2022 Peak
• Freddie Mac House Price Index Increased in September; Up 3.6% Year-over-year
• Lawler: Mortgage Rates Have Surged Since the Federal Reserve Cut Interest Rates Last Month
• A Proposal to Address the Housing Crisis
This is usually published 4 to 6 times a week and provides more in-depth analysis of the housing market.
Schedule for Week of November 3, 2024
by Calculated Risk on 11/02/2024 08:11:00 AM
The FOMC meets this week and is expected to cut rates.
No major economic releases scheduled.
All day: U.S. Election
 8:30 AM: Trade Balance report for September from the Census Bureau. The consensus is for the deficit to be $73.5 billion in September, from $70.4 billion in August.
This graph shows the U.S. trade deficit, with and without petroleum, through the most recent report.
The blue line is the total deficit, and the black line is the petroleum deficit, and the red line is the trade deficit ex-petroleum products.
10:00 AM: the ISM Services Index for October. The consensus is for a decrease to 53.3 from 54.9.
7:00 AM ET: The Mortgage Bankers Association (MBA) will release the results for the mortgage purchase applications index.
8:30 AM: The initial weekly unemployment claims report will be released. The consensus is for 224 thousand initial claims, up from 216 thousand last week.
2:00 PM: FOMC Meeting Announcement. The Fed is expected to cut rates 25bp at this meeting.
2:30 PM: Fed Chair Jerome Powell holds a press briefing following the FOMC announcement.
10:00 AM: University of Michigan's Consumer sentiment index (Preliminary for November).
Friday, November 01, 2024
Inflation Adjusted House Prices 1.5% Below 2022 Peak; Price-to-rent index is 8.1% below 2022 peak
by Calculated Risk on 11/01/2024 09:10:00 AM
Today, in the Calculated Risk Real Estate Newsletter: Inflation Adjusted House Prices 1.5% Below 2022 Peak
Excerpt:
It has been over 18 years since the bubble peak. In the August Case-Shiller house price index on Tuesday, the seasonally adjusted National Index (SA), was reported as being 75% above the bubble peak in 2006. However, in real terms, the National index (SA) is about 11% above the bubble peak (and historically there has been an upward slope to real house prices). The composite 20, in real terms, is 3% above the bubble peak.
People usually graph nominal house prices, but it is also important to look at prices in real terms. As an example, if a house price was $300,000 in January 2010, the price would be $433,000 today adjusted for inflation (44% increase). That is why the second graph below is important - this shows "real" prices.
The third graph shows the price-to-rent ratio, and the fourth graph is the affordability index. The last graph shows the 5-year real return based on the Case-Shiller National Index.
...
The second graph shows the same two indexes in real terms (adjusted for inflation using CPI).
In real terms (using CPI), the National index is 1.5% below the recent peak, and the Composite 20 index is 1.6% below the recent peak in 2022. Both indexes increased in August in real terms.
It has now been 27 months since the real peak in house prices. Typically, after a sharp increase in prices, it takes a number of years for real prices to reach new highs (see House Prices: 7 Years in Purgatory)

Comments on October Employment Report
by Calculated Risk on 11/01/2024 09:07:00 AM
The headline jobs number in the October employment report was below expectations, and August and September payrolls were revised down by 112,000 combined. The participation rate and the employment population ratio declined, and the unemployment rate was unchanged at 4.1%.
Seasonal Retail Hiring
Typically, retail companies start hiring for the holiday season in October, and really increase hiring in November. Here is a graph that shows the historical net retail jobs added for October, November and December by year.
 This graph really shows the collapse in retail hiring in 2008. Since then, seasonal hiring had increased back close to more normal levels. Note: I expect the long-term trend will be down with more and more internet holiday shopping.
Retailers hired 125 thousand workers Not Seasonally Adjusted (NSA) net in October. This was lower than last year and suggests slightly less real retail sales this holiday season as last year.
This was seasonally adjusted (SA) to a loss of 6.4 thousand retail jobs in October.
Prime (25 to 54 Years Old) Participation
 Since the overall participation rate is impacted by both cyclical (recession) and demographic (aging population, younger people staying in school) reasons, here is the employment-population ratio for the key working age group: 25 to 54 years old.
The 25 to 54 years old participation rate decreased in October to 83.5% from 83.8% in September.
The 25 to 54 employment population ratio decreased to 80.6% from 80.9% the previous month.
Both are above pre-pandemic levels and near the highest level this millennium.
Average Hourly Wages
 The graph shows the nominal year-over-year change in "Average Hourly Earnings" for all private employees from the Current Employment Statistics (CES).
Average Hourly Wages
 The graph shows the nominal year-over-year change in "Average Hourly Earnings" for all private employees from the Current Employment Statistics (CES).
 There was a huge increase at the beginning of the pandemic as lower paid employees were let go, and then the pandemic related spike reversed a year later.
Wage growth has trended down after peaking at 5.9% YoY in March 2022 and was at 4.0% YoY in October.
Wage growth has trended down after peaking at 5.9% YoY in March 2022 and was at 4.0% YoY in October.
Part Time for Economic Reasons
 From the BLS report:
"The number of people employed part time for economic reasons was little changed at 4.6 million in October. These individuals would have preferred full-time employment but were working part time because their hours had been reduced or they were unable to find full-time jobs."The number of persons working part time for economic reasons decreased in October to 4.56 million from 4.62 million in September. This is above the pre-pandemic levels.
These workers are included in the alternate measure of labor underutilization (U-6) that was unchanged at 7.7% from 7.7% in the previous month. This is down from the record high in April 2020 of 23.0% and up from the lowest level on record (seasonally adjusted) in December 2022 (6.5%). (This series started in 1994). This measure is above the 7.0% level in February 2020 (pre-pandemic).
Unemployed over 26 Weeks
 This graph shows the number of workers unemployed for 27 weeks or more.
 According to the BLS, there are 1.61 million workers who have been unemployed for more than 26 weeks and still want a job, essentialy unchanged from 1.63 million the previous month.
This is down from post-pandemic high of 4.174 million, and up from the recent low of 1.050 million.
This is above pre-pandemic levels.
Job Streak
Summary:
The headline jobs number in the October employment report was below expectations, and August and September payrolls were revised down by 112,000 combined. The participation rate and the employment population ratio declined, and the unemployment rate was unchanged at 4.1%.
This is above pre-pandemic levels.
Job Streak
Through October 2024, the employment report indicated positive job growth for 46 consecutive months, putting the current streak in a tie for 3rd place of the longest job streaks in US history (since 1939). It appears this streak will survive the annual benchmark revision (that will revise down job growth).
| Headline Jobs, Top 10 Streaks | ||
|---|---|---|
| Year Ended | Streak, Months | |
| 1 | 2019 | 100 |
| 2 | 1990 | 48 |
| 3 tie | 2007 | 46 |
| 3 tie | 20241 | 46 |
| 5 | 1979 | 45 |
| 6 tie | 1943 | 33 |
| 6 tie | 1986 | 33 |
| 6 tie | 2000 | 33 |
| 9 | 1967 | 29 |
| 10 | 1995 | 25 |
| 1Currrent Streak | ||
Summary:
The headline jobs number in the October employment report was below expectations, and August and September payrolls were revised down by 112,000 combined. The participation rate and the employment population ratio declined, and the unemployment rate was unchanged at 4.1%.
This report was impacted by strikes (especially Boeing) and the hurricanes. This makes interpreting this report difficult.
October Employment Report: 12 thousand Jobs, 4.1% Unemployment Rate
by Calculated Risk on 11/01/2024 08:30:00 AM
From the BLS: Employment Situation
Total nonfarm payroll employment was essentially unchanged in October (+12,000), and the unemployment rate was unchanged at 4.1 percent, the U.S. Bureau of Labor Statistics reported today. Employment continued to trend up in health care and government. Temporary help services lost jobs. Employment declined in manufacturing due to strike activity.
...
The change in total nonfarm payroll employment for August was revised down by 81,000, from +159,000 to +78,000, and the change for September was revised down by 31,000, from +254,000 to +223,000. With these revisions, employment in August and September combined is 112,000 lower than previously reported.
emphasis added
 Click on graph for larger image.
The first graph shows the jobs added per month since January 2021.
Total payrolls increased by 12 thousand in October. Private payrolls decreased by 28 thousand, and public payrolls increased 40 thousand.
Payrolls for August and September were revised down 112 thousand, combined.
Payrolls for August and September were revised down 112 thousand, combined.
 The second graph shows the year-over-year change in total non-farm employment since 1968.
In October, the year-over-year change was 2.17 million jobs. Employment was up solidly year-over-year (Although the annual benchmark revision will lower the year-over-year change).
The third graph shows the employment population ratio and the participation rate.
 The Labor Force Participation Rate decreased to 62.6% in October, from 62.7% in September. This is the percentage of the working age population in the labor force.
 The Employment-Population ratio decreased to 60.0% from 60.2% in September (blue line).
I'll post the 25 to 54 age group employment-population ratio graph later.
 The fourth graph shows the unemployment rate.
 The unemployment rate was unchanged at 4.1% in October from 4.1% in September.
This was below consensus expectations, and August and September payrolls were revised down by 112,000 combined.
This report was impacted by strikes and hurricanes.
I'll have more later ...Thursday, October 31, 2024
Friday: Employment Report, ISM Mfg, Construction Spending, Vehicle Sales
by Calculated Risk on 10/31/2024 08:01:00 PM
 Note: Mortgage rates are from MortgageNewsDaily.com and are for top tier scenarios.
Friday:
• At 8:30 AM ET, Employment Report for October. The consensus is for 120,000 jobs added, and for the unemployment rate to be unchanged at 4.1%.
• At 10:00 AM, ISM Manufacturing Index for October. The consensus is for 47.6, up from 47.2.
• Also at 10:00 AM, Construction Spending for September. The consensus is for no change in spending.
• All day, Light vehicle sales for October.
Realtor.com Reports Active Inventory Up 27.6% YoY
by Calculated Risk on 10/31/2024 04:41:00 PM
What this means: On a weekly basis, Realtor.com reports the year-over-year change in active inventory and new listings. On a monthly basis, they report total inventory. For September, Realtor.com reported inventory was up 34.0% YoY, but still down 23.2% compared to the 2017 to 2019 same month levels.
Now - on a weekly basis - inventory is up 27.6% YoY.
Realtor.com has monthly and weekly data on the existing home market. Here is their weekly report: Weekly Housing Trends View—Data for Week Ending Oct. 26, 2024 Here is a graph of the year-over-year change in inventory according to realtor.com.
Inventory was up year-over-year for the 51st consecutive week.
Realtor.com has monthly and weekly data on the existing home market. Here is their weekly report: Weekly Housing Trends View—Data for Week Ending Oct. 26, 2024
• Active inventory increased, with for-sale homes 27.6% above year-ago levels.
For the 51st consecutive weeks dating back to November 2023, the number of listings for sale has grown year-over-year. This week’s growth was lower than last week’s, the fifth week of slowing growth, and the lowest annual change since April. Much of the inventory build up is due to more seller activity than buyer activity. However, if mortgage rates keep rising in the short term, we could see a decline in both seller and buyer activity.
• New listings–a measure of sellers putting homes up for sale-increased 0.7% this week compared to one year ago.
The number of new listings on the market was lower than the same week last year. The recent upward trajectory of mortgage rates could largely discourage sellers from listing their homes ...
 Here is a graph of the year-over-year change in inventory according to realtor.com.
 Inventory was up year-over-year for the 51st consecutive week.
However, inventory is still historically low.
New listings remain below typical pre-pandemic levels.
October Employment Preview
by Calculated Risk on 10/31/2024 02:55:00 PM
On Friday at 8:30 AM ET, the BLS will release the employment report for October. The consensus is for 120,000 jobs added, and for the unemployment rate to be unchanged at 4.1%.
There were 254,000 jobs added in September, and the unemployment rate was at 4.1%.
From BofA:
• ISM Surveys: Note that the ISM indexes are diffusion indexes based on the number of firms hiring (not the number of hires). The indexes will be released after the employment report.
• Unemployment Claims: The weekly claims report showed more initial unemployment claims during the reference week at 242,000 in October compared to 222,000 in September. This suggests more layoffs in October compared to September (likely due to hurricanes).
We expect nonfarm payrolls to rise by 100k in Oct after coming in at 254k in Sep. ... the u-rate should move back up to 4.2%, in part due to hurricane distortions.From Goldman Sachs:
emphasis added
We estimate nonfarm payrolls rose by 95k in October, below consensus of +105k and the three-month average of +186k. Alternative measures of employment growth were mixed, and strikes and the recent hurricanes likely weighed on payrolls growth this month. ... We estimate that the unemployment rate was unchanged at 4.1%, in line with consensus.• ADP Report: The ADP employment report showed 233,000 private sector jobs were added in October. This was well above consensus forecasts and suggests job gains above consensus expectations, however, in general, ADP hasn't been very useful in forecasting the BLS report (this also doesn't include the Boeing strike and probably misses some of the hurricane impact).
• ISM Surveys: Note that the ISM indexes are diffusion indexes based on the number of firms hiring (not the number of hires). The indexes will be released after the employment report.
• Unemployment Claims: The weekly claims report showed more initial unemployment claims during the reference week at 242,000 in October compared to 222,000 in September. This suggests more layoffs in October compared to September (likely due to hurricanes).
• Strikes: The CES strike report shows 41,000 additional employees on strike during the reference period in October. This will reduce the headline jobs number.
• Hurricane Impact: Analysts are trying to estimate the distortion from Hurrican Milton. In September 2005, the initial BLS report showed a loss of 35 thousand jobs due to the impact of Hurricanes Katrina and Rita (Katrina hit in late August, and Rita during the reference period in September). This was eventually revised to a gain of 57 thousand (still well below the average for the year of 210 thousand per month. Milton also made landfall during the reference period, so the BLS will try to adjust for impact.
• Conclusion: Employment gains have average 167 thousand over the last 6 months. Subtracting 41 thousand for the strikes, and maybe 50 thousand for the hurricane impact would suggest employment gains will be below consensus expectations.
Freddie Mac House Price Index Increased in September; Up 3.6% Year-over-year
by Calculated Risk on 10/31/2024 11:32:00 AM
Today, in the Calculated Risk Real Estate Newsletter: Freddie Mac House Price Index Increased in September; Up 3.6% Year-over-year
A brief excerpt:
Freddie Mac reported that its “National” Home Price Index (FMHPI) increased 0.28% month-over-month on a seasonally adjusted (SA) basis in September. On a year-over-year basis, the National FMHPI was up 3.6% in September, down from up 4.0% YoY in August. The YoY increase peaked at 19.1% in July 2021, and for this cycle, bottomed at up 0.9% YoY in May 2023. ...
As of September, 11 states were below their previous peaks, Seasonally Adjusted. The largest seasonally adjusted declines from the recent peak were in Florida (-2.2%), Louisiana (-1.8%), Arizona (-1.7%), North Carolina (-1.5), and Arkansas (-1.3%).
For cities (Core-based Statistical Areas, CBSA), here are the 30 cities with the largest declines from the peak, seasonally adjusted. Austin continues to be the worst performing city. However, 17 of the 30 worst performing cities are now in Florida!
And 9 of the 12 worst performing cities are in Florida.

There is much more in the article.
Personal Income increased 0.3% in September; Spending increased 0.5%
by Calculated Risk on 10/31/2024 08:40:00 AM
The BEA released the Personal Income and Outlays report for September:
Personal income increased $71.6 billion (0.3 percent at a monthly rate) in September, according to estimates released today by the U.S. Bureau of Economic Analysis. Disposable personal income (DPI), personal income less personal current taxes, increased $57.4 billion (0.3 percent) and personal consumption expenditures (PCE) increased $105.8 billion (0.5 percent).The September PCE price index increased 2.1 percent year-over-year (YoY), down from 2.3 percent YoY in August, and down from the recent peak of 7.0 percent in June 2022.
The PCE price index increased 0.2 percent. Excluding food and energy, the PCE price index increased 0.3 percent. Real DPI increased 0.1 percent in September and real PCE increased 0.4 percent; goods increased 0.7 percent and services increased 0.2 percent.
emphasis added
The PCE price index, excluding food and energy, increased 2.7 percent YoY, unchanged from 2.7 percent in August, and down from the recent peak of 5.4 percent in February 2022.
The following graph shows real Personal Consumption Expenditures (PCE) through September 2024 (2017 dollars). Note that the y-axis doesn't start at zero to better show the change.
 Click on graph for larger image.
The dashed red lines are the quarterly levels for real PCE.
Personal income was slightly below expectations, and PCE was slightly above expectations.
Inflation was close to expectations.
Weekly Initial Unemployment Claims Decrease to 216,000
by Calculated Risk on 10/31/2024 08:30:00 AM
The DOL reported:
In the week ending October 26, the advance figure for seasonally adjusted initial claims was 216,000, a decrease of 12,000 from the previous week's revised level. The previous week's level was revised up by 1,000 from 227,000 to 228,000. The 4-week moving average was 236,500, a decrease of 2,250 from the previous week's revised average. The previous week's average was revised up by 250 from 238,500 to 238,750.The following graph shows the 4-week moving average of weekly claims since 1971.
emphasis added
 Click on graph for larger image.
The dashed line on the graph is the current 4-week average. The four-week average of weekly unemployment claims decreased to 236,500.
The previous week was revised up.
Weekly claims were below the consensus forecast.
Wednesday, October 30, 2024
Thursday: Personal Income and Outlays, Unemployment Claims
by Calculated Risk on 10/30/2024 08:05:00 PM
 Note: Mortgage rates are from MortgageNewsDaily.com and are for top tier scenarios.
Thursday:
• At 8:30 AM ET, The initial weekly unemployment claims report will be released. The consensus is for 230 thousand initial claims, up from 227 thousand last week.
• Also at 8:30 AM, Personal Income and Outlays for September. The consensus is for a 0.4% increase in personal income, and for a 0.4% increase in personal spending. And for the Core PCE price index to increase 0.3%. PCE prices are expected to be up 2.1% YoY, and core PCE prices up 2.6% YoY.
• At 9:45 AM, Chicago Purchasing Managers Index for October. The consensus is for a reading of 46.0, down from 46.6 in September.
Fannie and Freddie: Single Family and Multi-Family Serious Delinquency Rates Increased in September
by Calculated Risk on 10/30/2024 12:38:00 PM
Today, in the Calculated Risk Real Estate Newsletter: Fannie and Freddie: Single Family and Multi-Family Serious Delinquency Rates Increased in September
Excerpt:
Single-family serious delinquencies increased slightly in September, and multi-family serious delinquencies increased.
Freddie Mac reported that the Single-Family serious delinquency rate in September was 0.54%, up from 0.52% August. Freddie's rate is down slightly year-over-year from 0.55% in September 2023. This is below the pre-pandemic lows.
Freddie's serious delinquency rate peaked in February 2010 at 4.20% following the housing bubble and peaked at 3.17% in August 2020 during the pandemic.Fannie Mae reported that the Single-Family serious delinquency rate in September was 0.52%, up from 0.50% in August. The serious delinquency rate is down year-over-year from 0.54% in September 2023. This is also below the pre-pandemic lows.
The Fannie Mae serious delinquency rate peaked in February 2010 at 5.59% following the housing bubble and peaked at 3.32% in August 2020 during the pandemic.

There is much more in the article.
NAR: Pending Home Sales Increase 7.4% in September; Up 2.6% Year-over-year
by Calculated Risk on 10/30/2024 10:00:00 AM
From the NAR: Pending Home Sales Advanced 7.4% in September
ending home sales rose in September, according to the National Association of REALTORS®. All four major regions experienced month-over-month gains in transactions. Year-over-year, the Northeast and West registered increases while sales remained steady in the Midwest and South.This was well above expectations. Note: Contract signings usually lead sales by about 45 to 60 days, so this would usually be for closed sales in October and November. The NAR also included their forecast:
The Pending Home Sales Index (PHSI)* – a forward-looking indicator of home sales based on contract signings – jumped 7.4% to 75.8 in September, the highest level since March (78.3). Year-over-year, pending transactions ascended 2.6%. An index of 100 is equal to the level of contract activity in 2001.
“Contract signings rose across all regions of the country as buyers took advantage of the combination of lower mortgage rates in late summer and more inventory choices,” said NAR Chief Economist Lawrence Yun. “Further gains are expected if the economy continues to add jobs, inventory levels grow, and mortgage rates hold steady.”
...
The Northeast PHSI expanded 6.5% from last month to 65.6, up 3.3% from September 2023. The Midwest index surged 7.1% to 75.0 in September, identical to the previous year.
The South PHSI improved 6.7% to 89.0 in September, unchanged from a year ago. The West index ballooned by 9.8% from the prior month to 64.0, up 12.3% from September 2023.
emphasis added
In the next two years, Yun foresees slower home price appreciation and corresponding increases in sales..
“After two years of sluggish home sales in 2023 and 2024, existing-home sales are forecasted to rise to 4.47 million in 2025 and more than 5 million in 2026,” Yun said. “During the next two years, expect a slower rate of growth in home prices that’s roughly in line with the consumer price index because of additional supply reaching the market.”
Yun predicts the median existing-home price will rise to $410,700 in 2025 and to $420,000 in 2026. The annual 30-year fixed mortgage rate will slide to 5.9% in 2025 but then move higher to 6.1% in 2026
BEA: Real GDP increased at 2.8% Annualized Rate in Q3
by Calculated Risk on 10/30/2024 08:30:00 AM
From the BEA: Gross Domestic Product, Third Quarter 2024 (Advance Estimate)
Real gross domestic product (GDP) increased at an annual rate of 2.8 percent in the third quarter of 2024, according to the "advance" estimate released by the U.S. Bureau of Economic Analysis. In the second quarter, real GDP increased 3.0 percent.PCE increased at a 3.7% annual rate, and residential investment decreased at a 5.1% rate. The advance Q2 GDP report, with 2.8% annualized increase, was below expectations.
...
The increase in real GDP primarily reflected increases in consumer spending, exports, and federal government spending. Imports, which are a subtraction in the calculation of GDP, increased.
The increase in consumer spending reflected increases in both goods and services. Within goods, the leading contributors were other nondurable goods (led by prescription drugs) and motor vehicles and parts. Within services, the leading contributors were health care (led by outpatient services) as well as food services and accommodations. The increase in exports primarily reflected an increase in goods (led by capital goods, excluding automotive). The increase in federal government spending was led by defense spending. The increase in imports primarily reflected an increase in goods (led by capital goods, excluding automotive).
Compared to the second quarter, the deceleration in real GDP in the third quarter primarily reflected a downturn in private inventory investment and a larger decrease in residential fixed investment. These movements were partly offset by accelerations in exports, consumer spending, and federal government spending. Imports accelerated.
emphasis added
I'll have more later ...
ADP: Private Employment Increased 233,000 in October
by Calculated Risk on 10/30/2024 08:15:00 AM
– Private sector employment increased by 233,000 jobs in October and annual pay was up 4.6 percent year-over-year, according to the October ADP® National Employment ReportTM produced by the ADP Research Institute® in collaboration with the Stanford Digital Economy Lab (“Stanford Lab”). ...This was well above the consensus forecast of 110,000. The BLS report will be released Friday, and the consensus is for 140,000 non-farm payroll jobs added in October. Note: ADP doesn't include the Boeing strike, and probably was impacted less by the hurricanes than the BLS report.
“Even amid hurricane recovery, job growth was strong in October,” said Nela Richardson, chief economist, ADP. “As we round out the year, hiring in the U.S. is proving to be robust and broadly resilient.”
emphasis added
MBA: Mortgage Applications Decreased in Weekly Survey
by Calculated Risk on 10/30/2024 07:00:00 AM
From the MBA: Mortgage Applications Decrease in Latest MBA Weekly Survey
Mortgage applications decreased 0.1 percent from one week earlier, according to data from the Mortgage Bankers Association’s (MBA) Weekly Applications Survey for the week ending October 25, 2024.
The Market Composite Index, a measure of mortgage loan application volume, decreased 0.1 percent on a seasonally adjusted basis from one week earlier. On an unadjusted basis, the Index decreased 1 percent compared with the previous week. The Refinance Index decreased 6 percent from the previous week and was 84 percent higher than the same week one year ago. The seasonally adjusted Purchase Index increased 5 percent from one week earlier. The unadjusted Purchase Index increased 4 percent compared with the previous week and was 10 percent higher than the same week one year ago.
“Mortgage applications were essentially flat last week as rates increased for the fourth time in five weeks, driven by bond market volatility in advance of the presidential election and the next FOMC meeting. The 30-year fixed rate, at 6.73 percent, was at its highest level since July 2024,” said Joel Kan, MBA’s Vice President and Deputy Chief Economist. “After a brief burst of activity in September when rates were almost 60 basis points lower, overall applications have declined 27 percent, driven by a pullback in refinances. Government refinances accounted for a large part of the decrease, dropping 12 percent over last week.”
Added Kan, “Purchase applications increased compared to a holiday-shortened week and were 10 percent higher than a year ago. While near-term purchase application activity has weakened, we continue to expect housing demand from younger homebuyers to support purchase growth over the next few years as for-sale inventory loosens gradually.”
...
The average contract interest rate for 30-year fixed-rate mortgages with conforming loan balances ($766,550 or less) increased to 6.73 percent from 6.52 percent, with points increasing to 0.69 from 0.64 (including the origination fee) for 80 percent loan-to-value ratio (LTV) loans
emphasis added
 Click on graph for larger image.
The first graph shows the MBA mortgage purchase index.
According to the MBA, purchase activity is up 10% year-over-year unadjusted.
Red is a four-week average (blue is weekly).
Purchase application activity is up about 10% from the lows in late October 2023, but still about 9% below the lowest levels during the housing bust.

The second graph shows the refinance index since 1990.
With higher mortgage rates, the refinance index increased significantly as mortgage rates declined last month but decreased over the last five weeks as rates moved back up.


