 RSS Feed
 by Calculated Risk on 10/09/2024 11:23:00 AM
Wednesday, October 09, 2024
1st Look at Local Housing Markets in September
Today, in the Calculated Risk Real Estate Newsletter: 1st Look at Local Housing Markets in September
A brief excerpt:
NOTE: The tables for active listings, new listings and closed sales all include a comparison to September 2019 for each local market (some 2019 data is not available).There is much more in the article.
This is the first look at several early reporting local markets in September. I’m tracking over 40 local housing markets in the US. Some of the 40 markets are states, and some are metropolitan areas. I’ll update these tables throughout the month as additional data is released.
Closed sales in September were mostly for contracts signed in July and August when 30-year mortgage rates averaged 6.85% and 6.50%, respectively (Freddie Mac PMMS).
...
In September, sales in these markets were unchanged YoY. Last month, in August, these same markets were down 2.3% year-over-year Not Seasonally Adjusted (NSA).
Important: There were the same number of working days in September 2024 (20) as in September 2023 (20). So, the year-over-year change in the headline SA data will be similar to the NSA data. Last month there was one fewer working day in August 2024 compared to August 2023 (22 vs 23), so seasonally adjusted sales were down less than NSA sales.
Sales in all of these markets are down significantly compared to September 2019.
...
This was just several early reporting markets. Many more local markets to come!

MBA: Mortgage Applications Decreased in Weekly Survey
by Calculated Risk on 10/09/2024 07:00:00 AM
From the MBA: Mortgage Applications Decrease in Latest MBA Weekly Survey
Mortgage applications decreased 5.1 percent from one week earlier, according to data from the Mortgage Bankers Association’s (MBA) Weekly Applications Survey for the week ending October 4, 2024.
The Market Composite Index, a measure of mortgage loan application volume, decreased 5.1 percent on a seasonally adjusted basis from one week earlier. On an unadjusted basis, the Index decreased 5 percent compared with the previous week. The Refinance Index decreased 9 percent from the previous week and was 159 percent higher than the same week one year ago. The seasonally adjusted Purchase Index decreased 0.1 percent from one week earlier. The unadjusted Purchase Index increased 0.1 percent compared with the previous week and was 8 percent higher than the same week one year ago.
“In the wake of stronger economic data last week, including the September jobs report, mortgage rates moved higher, with the 30-year fixed rate rising to 6.36 percent – the highest since August,” said Mike Fratantoni, MBA’s SVP and Chief Economist. “Conventional loan refinances, which tend to have larger balances than government loans and hence are more responsive for a given change in mortgage rates, fell to a greater extent over the week. Purchase application volume was little changed over the week and was 8 percent above last year’s level.”
Added Fratantoni, “As we have highlighted before, the decision to buy a home is impacted by many factors, not just the level of mortgage rates. The largest constraint for many prospective homebuyers over the past year had been the lack of inventory. Now, there are more homes available in many markets across the country, and with mortgage rates still low compared to recent history, at least some potential homebuyers are moving ahead.”
...
The average contract interest rate for 30-year fixed-rate mortgages with conforming loan balances ($766,550 or less) increased to 6.36 percent from 6.14 percent, with points increasing to 0.62 from 0.61 (including the origination fee) for 80 percent loan-to-value ratio (LTV) loans.
emphasis added
 Click on graph for larger image.
The first graph shows the MBA mortgage purchase index.
According to the MBA, purchase activity is up 8% year-over-year unadjusted.
Red is a four-week average (blue is weekly).
Purchase application activity is up about 19% from the lows in late October 2023, but still about 1% below the lowest levels during the housing bust.

The second graph shows the refinance index since 1990.
With higher mortgage rates, the refinance index increased significantly recently as mortgage rates declined but decreased slightly over the last two weeks with as rates increased.
Tuesday, October 08, 2024
Wednesday: FOMC Minutes
by Calculated Risk on 10/08/2024 08:42:00 PM
 Note: Mortgage rates are from MortgageNewsDaily.com and are for top tier scenarios.
Wednesday:
• At 7:00 AM ET, The Mortgage Bankers Association (MBA) will release the results for the mortgage purchase applications index.
• At 2:00 PM, FOMC Minutes, Minutes Meeting of September 17-18, 2024
Trade Deficit Decreased to $70.4 Billion in August
by Calculated Risk on 10/08/2024 08:36:00 PM
Note: the power was out in my neighborhood due to a large fallen tree. So, this is late ...
The U.S. Census Bureau and the U.S. Bureau of Economic Analysis announced today that the goods and services deficit was $70.4 billion in August, down $8.5 billion from $78.9 billion in July, revised.
August exports were $271.8 billion, $5.3 billion more than July exports. August imports were $342.2 billion, $3.2 billion less than July imports.
emphasis added
 Click on graph for larger image.
Exports increased and imports decreased in August.
Exports are up 5.1% year-over-year; imports are up 7.6% year-over-year.
Both imports and exports decreased sharply due to COVID-19 and then bounced back - imports and exports have generally increased recently.
The second graph shows the U.S. trade deficit, with and without petroleum.
 The blue line is the total deficit, and the black line is the petroleum deficit, and the red line is the trade deficit ex-petroleum products.
Note that net, exports of petroleum products are positive and have been increasing.
The trade deficit with China increased to $27.9 billion from $25.9 billion a year ago.
Monday, October 07, 2024
Tuesday: Trade Balance
by Calculated Risk on 10/07/2024 07:17:00 PM
 From Matthew Graham at Mortgage News Daily: Highest Mortgage Rates in 2 Months
It's been a strange and frustrating couple of weeks for anyone who mistakenly believed that mortgage rates would move lower after the Fed rate cut. ... Bottom line, markets got locked into the belief that data would slowly deteriorate (with a lot of weight being given to the last few jobs reports) only to see the most recent jobs report say "not so fast!" There's a bit of a re-set happening at the moment. We can't know exactly how big it will be until we get through more econ data. [30 year fixed 6.62%]Tuesday:
emphasis added
• At 6:00 AM ET, NFIB Small Business Optimism Index for September.
• At 8:30 AM, Trade Balance report for August from the Census Bureau. The consensus is for the deficit to be $71.4 billion in August, from $78.8 billion in July.
ICE Mortgage Monitor: Insurance Costs "Spike", Especially in Florida
by Calculated Risk on 10/07/2024 11:42:00 AM
Today, in the Real Estate Newsletter: ICE Mortgage Monitor: Insurance Costs "Spike", Especially in Florida
Brief excerpt:
The largest insurance increases are in Florida (for obvious reasons - stay safe this week with Hurricane Milton).There is much more in the newsletter.
• While monthly principal, interest, and property tax obligations are up an average 15-17% since the beginning of 2020, the average monthly property insurance payment is up a whopping 52% over that same period
• In New Orleans, as well as Florida markets such as Deltona, Jacksonville and Cape Coral, monthly property insurance payments increased more than 80%
• Premiums also surged in areas with rising home values, including Utah; Boise, Idaho; and Midwest/Eastern Slope markets like Omaha, Denver and Colorado Springs, which have faced increased risks from tornados and hail damage
“Annual price growth slowed to +3.0%”

Wholesale Used Car Prices Decreased in September; Down 5.3% Year-over-year
by Calculated Risk on 10/07/2024 09:40:00 AM
From Manheim Consulting today: Wholesale Used-Vehicle Prices Declined in September
Wholesale used-vehicle prices (on a mix, mileage, and seasonally adjusted basis) were lower in September compared to August. The Manheim Used Vehicle Value Index (MUVVI) fell to 203.0, a decline of 5.3% from a year ago. The seasonal adjustment to the index amplified the change for the month, as non-seasonally adjusted values fell slightly. The non-adjusted price in September decreased by 0.1% compared to August, moving the unadjusted average price down 4.9% year over year.
emphasis added
 Click on graph for larger image.
This index from Manheim Consulting is based on all completed sales transactions at Manheim’s U.S. auctions.
The Manheim index suggests used car prices decreased in September (seasonally adjusted) and were down 5.3% year-over-year (YoY).
Housing Oct 7th Weekly Update: Inventory up 0.4% Week-over-week, Up 36.7% Year-over-year
by Calculated Risk on 10/07/2024 08:11:00 AM
Altos reports that active single-family inventory was up 0.4% week-over-week. Inventory is now up 48.6% from the February seasonal bottom.
The first graph shows the seasonal pattern for active single-family inventory since 2015.
 Click on graph for larger image.
The red line is for 2024. The black line is for 2019.
Inventory was up 36.7% compared to the same week in 2023 (last week it was up 36.7%), and down 23.1% compared to the same week in 2019 (last week it was down 23.4%).
Back in June 2023, inventory was down almost 54% compared to 2019, so the gap to more normal inventory levels is closing.
 This second inventory graph is courtesy of Altos Research.
As of October 4th, inventory was at 734 thousand (7-day average), compared to 731 thousand the prior week.
This is the highest level of inventory since May 2020.
Mike Simonsen discusses this data regularly on Youtube.
Sunday, October 06, 2024
Sunday Night Futures
by Calculated Risk on 10/06/2024 07:34:00 PM
Weekend:
• Schedule for Week of October 6, 2024
Monday:
• No major economic releases scheduled.
From CNBC: Pre-Market Data and Bloomberg futures S&P 500 and DOW futures are mostly unchanged (fair value).
Oil prices were up over the last week with WTI futures at $73.98 per barrel and Brent at $77.59 per barrel. A year ago, WTI was at $83, and Brent was at $88 - so WTI oil prices are down about 10% year-over-year.
Here is a graph from Gasbuddy.com for nationwide gasoline prices. Nationally prices are at $3.13 per gallon. A year ago, prices were at $3.71 per gallon, so gasoline prices are down $0.58 year-over-year.
Moody's: Retail Vacancy Rate Decreased Slightly in Q3
by Calculated Risk on 10/06/2024 08:14:00 AM
Note: I covered apartments and offices in the newsletter: Moody's: Apartment Vacancy Rate Unchanged in Q3; Office Vacancy Rate at Record High
From Moody’s Analytics economists: Multifamily Performance Steadied, Office Stress Continued to Manifest, Retail Vacancy Declined, And Industrial Cooled Down
The Q3 2024 data indicated a slight decrease in the longstanding 10.4% vacancy rate for the retail sector, dropping to 10.3% this quarter. Asking rents saw a marginal increase of 0.3% to $21.85, while effective rents rose by 0.4% to $24.87 per square foot. Consumer spending in the third quarter has thus far exceeded expectations, particularly in July, which experienced a 1.1% increase. Although August saw a modest 0.1% increase, it surpassed the anticipated -0.2% decrease. These results were propelled by robust performance in online purchases and core retail sales, excluding automobiles, gasoline, building materials, and food services, alongside a decline in the unemployment rate following four consecutive monthly increases.
 This graph shows the strip mall vacancy rate starting in 1980 (prior to 2000 the data is annual).
 Back in the '80s, there was overbuilding in the mall sector even as the vacancy rate was rising. This was due to the very loose commercial lending that led to the S&L crisis.
In the mid-'00s, mall investment picked up as mall builders followed the "roof tops" of the residential boom (more loose lending). This led to the vacancy rate moving higher even before the recession started. Then there was a sharp increase in the vacancy rate during the recession and financial crisis.
In the mid-'00s, mall investment picked up as mall builders followed the "roof tops" of the residential boom (more loose lending). This led to the vacancy rate moving higher even before the recession started. Then there was a sharp increase in the vacancy rate during the recession and financial crisis.
Recently the vacancy rate has held fairly steady at a high level as online shopping continues to impact brick and mortar stores.
Saturday, October 05, 2024
Real Estate Newsletter Articles this Week: Freddie Mac House Price Index Increased Slightly in August
by Calculated Risk on 10/05/2024 02:11:00 PM
At the Calculated Risk Real Estate Newsletter this week:
 Click on graph for larger image.
• FHFA’s National Mortgage Database: Outstanding Mortgage Rates, LTV and Credit Scores
• Moody's: Apartment Vacancy Rate Unchanged in Q3; Office Vacancy Rate at Record High
• Freddie Mac House Price Index Increased Slightly in August; Up 3.7% Year-over-year
• Asking Rents Mostly Unchanged Year-over-year
• Final Look at Local Housing Markets in August and a Look Ahead to September Sales
This is usually published 4 to 6 times a week and provides more in-depth analysis of the housing market.
Schedule for Week of October 6, 2024
by Calculated Risk on 10/05/2024 08:11:00 AM
The key economic report this week is September CPI.
Other key indicators include September PPI and the August trade deficit.
No major economic releases scheduled.
6:00 AM: NFIB Small Business Optimism Index for September.
 8:30 AM: Trade Balance report for August from the Census Bureau. The consensus is for the deficit to be $71.4 billion in August, from $78.8 billion in July.
This graph shows the U.S. trade deficit, with and without petroleum, through the most recent report. The blue line is the total deficit, and the black line is the petroleum deficit, and the red line is the trade deficit ex-petroleum products.
7:00 AM ET: The Mortgage Bankers Association (MBA) will release the results for the mortgage purchase applications index.
2:00 PM: FOMC Minutes, Minutes Meeting of September 17-18, 2024
8:30 AM: The initial weekly unemployment claims report will be released. The consensus is for 228 thousand initial claims, up from 225 thousand last week.
8:30 AM: The Consumer Price Index for September from the BLS. The consensus is for a 0.1% increase in CPI, and a 0.2% increase in core CPI. The consensus is for CPI to be up 2.3% year-over-year and core CPI to be up 3.2% YoY.
8:30 AM: The Producer Price Index for September from the BLS. The consensus is for a 0.1% increase in PPI, and a 0.2% increase in core PPI.
10:00 AM: University of Michigan's Consumer sentiment index (Preliminary for October).
Friday, October 04, 2024
October 4th COVID Update: Wastewater Measure Declines Further
by Calculated Risk on 10/04/2024 07:00:00 PM
 Note: Mortgage rates are from MortgageNewsDaily.com and are for top tier scenarios.
For deaths, I'm currently using 4 weeks ago for "now", since the most recent three weeks will be revised significantly.
Note: "Effective May 1, 2024, hospitals are no longer required to report COVID-19 hospital admissions, hospital capacity, or hospital occupancy data." So I'm no longer tracking hospitalizations.
| COVID Metrics | ||||
|---|---|---|---|---|
| Now | Week Ago | Goal | ||
| Deaths per Week | 1,120 | 1,287 | ≤3501 | |
| 1my goals to stop weekly posts, 🚩 Increasing number weekly for Deaths ✅ Goal met. | ||||
 Click on graph for larger image.
This graph shows the weekly (columns) number of deaths reported.
Although weekly deaths met the original goal to stop posting, I'm continuing to post now that deaths are above the goal again.
Weekly deaths are almost quadruple the low of 302 in early June but are now declining and will likely continue to decline based on wastewater sampling.
 This appears to be a leading indicator for COVID hospitalizations and deaths.
COVID in wastewater is now declining suggesting weekly deaths will continue to decline.
Q3 GDP Tracking: Around 3%
by Calculated Risk on 10/04/2024 03:41:00 PM
From BofA:
Since our last weekly publication, our 3Q GDP tracking estimate is up three-tenths to 2.6% q/q saar. [Oct 4th estimate]From Goldman:
emphasis added
We left our Q3 GDP tracking estimate unchanged at +3.2% (quarter-over-quarter annualized) and our domestic final sales estimate unchanged at +2.8%. [Oct 3rd estimate]And from the Atlanta Fed: GDPNow
The GDPNow model estimate for real GDP growth (seasonally adjusted annual rate) in the third quarter of 2024 is 2.5 percent on October 1, down from 3.1 percent on September 27. [Oct 1st estimate]
Asking Rents Mostly Unchanged Year-over-year
by Calculated Risk on 10/04/2024 12:37:00 PM
Today, in the Real Estate Newsletter: Asking Rents Mostly Unchanged Year-over-year
Brief excerpt:
Tracking rents is important for understanding the dynamics of the housing market. For example, the sharp increase in rents helped me deduce that there was a surge in household formation in 2021 (See from September 2021: Household Formation Drives Housing Demand)....
Slower household formation and increased supply (more multi-family completions) has kept asking rents under pressure. ...
Welcome to the October 2024 Apartment List National Rent Report. The national median rent dipped by 0.5% in September, as we turn the corner into the slow season for the rental market. The median rent nationally now stands at $1,405, and we’re likely to see that number continue to dip modestly through the remainder of the year.

Realtor.com: 13th Consecutive Month with Year-over-year Decline in Rents
In August 2024, the U.S. median rent continued to decline year over year for the 13th month in a row, down $5, or -0.3%, year over year for 0-2 bedroom properties across the top 50 metros
Comments on September Employment Report
by Calculated Risk on 10/04/2024 09:16:00 AM
The headline jobs number in the September employment report was well above expectations, and July and August payrolls were revised up by 72,000 combined. The participation rate was unchanged, the employment population ratio increased, and the unemployment rate decreased to 4.1%.
Construction employment increased 25 thousand and is now 688 thousand above the pre-pandemic level.
Manufacturing employment decreased 7 thousand and is now 137 thousand above the pre-pandemic level.
Prime (25 to 54 Years Old) Participation
 Since the overall participation rate is impacted by both cyclical (recession) and demographic (aging population, younger people staying in school) reasons, here is the employment-population ratio for the key working age group: 25 to 54 years old.
The 25 to 54 years old participation decreased in September to 83.8% from 83.9% in August.
The 25 to 54 employment population ratio was unchanged at 80.9% from 80.9% the previous month.
Both are above pre-pandemic levels and near the highest level this millennium.
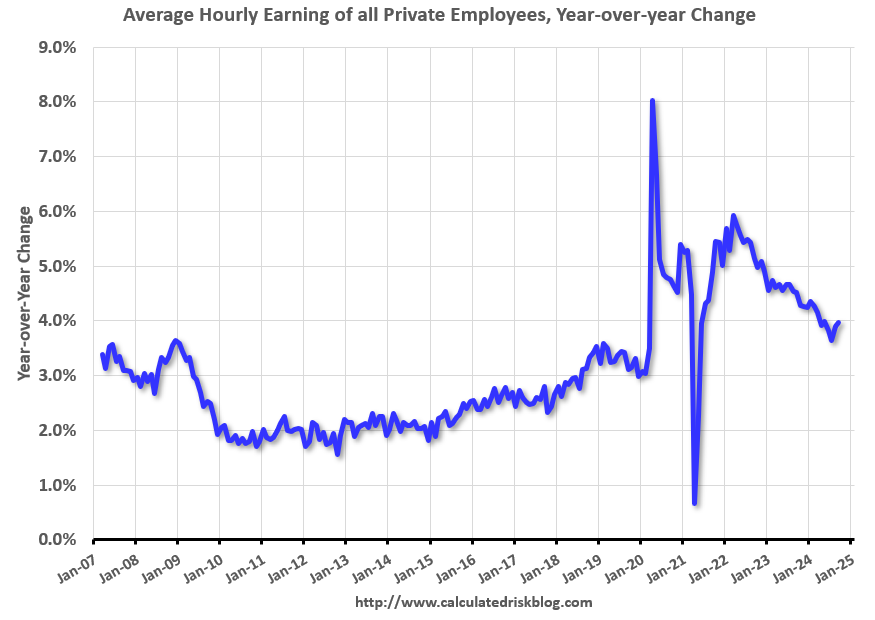
Average Hourly Wages
 The graph shows the nominal year-over-year change in "Average Hourly Earnings" for all private employees from the Current Employment Statistics (CES).
Average Hourly Wages
 The graph shows the nominal year-over-year change in "Average Hourly Earnings" for all private employees from the Current Employment Statistics (CES).
 There was a huge increase at the beginning of the pandemic as lower paid employees were let go, and then the pandemic related spike reversed a year later.
Wage growth has trended down after peaking at 5.9% YoY in March 2022 and was at 4.0% YoY in September.
Wage growth has trended down after peaking at 5.9% YoY in March 2022 and was at 4.0% YoY in September.
Part Time for Economic Reasons
 From the BLS report:
"The number of people employed part time for economic reasons changed little at 4.6 million in September. This measure is up from 4.1 million a year earlier. These individuals would have preferred full-time employment but were working part time because their hours had been reduced or they were unable to find full-time jobs."The number of persons working part time for economic reasons decreased in September to 4.62 million from 4.83 million in August. This is above the pre-pandemic levels.
These workers are included in the alternate measure of labor underutilization (U-6) that decreased to 7.7% from 7.9% in the previous month. This is down from the record high in April 2020 of 23.0% and up from the lowest level on record (seasonally adjusted) in December 2022 (6.5%). (This series started in 1994). This measure is above the 7.0% level in February 2020 (pre-pandemic).
Unemployed over 26 Weeks
 This graph shows the number of workers unemployed for 27 weeks or more.
 According to the BLS, there are 1.63 million workers who have been unemployed for more than 26 weeks and still want a job, up from 1.53 million the previous month.
This is down from post-pandemic high of 4.174 million, and up from the recent low of 1.050 million.
This is above pre-pandemic levels.
Job Streak
Summary:
The headline jobs number in the September employment report was well above expectations, and July and August payrolls were revised up by 72,000 combined. The participation rate was unchanged, the employment population ratio increased, and the unemployment rate decreased to 4.1%.
This is above pre-pandemic levels.
Job Streak
Through September 2024, the employment report indicated positive job growth for 45 consecutive months, putting the current streak tied in 4th place of the longest job streaks in US history (since 1939). It appears this streak will survive the annual benchmark revision (that will revise down job growth).
| Headline Jobs, Top 10 Streaks | ||
|---|---|---|
| Year Ended | Streak, Months | |
| 1 | 2019 | 100 |
| 2 | 1990 | 48 |
| 3 | 2007 | 46 |
| 4 tie | 1979 | 45 |
| 4 tie | 20241 | 45 |
| 6 tie | 1943 | 33 |
| 6 tie | 1986 | 33 |
| 6 tie | 2000 | 33 |
| 9 | 1967 | 29 |
| 10 | 1995 | 25 |
| 1Currrent Streak | ||
Summary:
The headline jobs number in the September employment report was well above expectations, and July and August payrolls were revised up by 72,000 combined. The participation rate was unchanged, the employment population ratio increased, and the unemployment rate decreased to 4.1%.
This was a strong employment report.
September Employment Report: 254 thousand Jobs, 4.1% Unemployment Rate
by Calculated Risk on 10/04/2024 08:30:00 AM
From the BLS: Employment Situation
Total nonfarm payroll employment increased by 254,000 in September, and the unemployment rate changed little at 4.1 percent, the U.S. Bureau of Labor Statistics reported today. Employment continued to trend up in food services and drinking places, health care, government, social assistance, and construction.
...
The change in total nonfarm payroll employment for July was revised up by 55,000, from +89,000 to +144,000, and the change for August was revised up by 17,000, from +142,000 to +159,000. With these revisions, employment in July and August combined is 72,000 higher than previously reported.
emphasis added
 Click on graph for larger image.
The first graph shows the jobs added per month since January 2021.
Total payrolls increased by 254 thousand in September. Private payrolls increased by 223 thousand, and public payrolls increased 32 thousand.
Payrolls for July and August were revised up 72 thousand, combined.
Payrolls for July and August were revised up 72 thousand, combined.
 The second graph shows the year-over-year change in total non-farm employment since 1968.
In September, the year-over-year change was 2.44 million jobs. Employment was up solidly year-over-year (Although the annual benchmark revision will lower the year-over-year change).
The third graph shows the employment population ratio and the participation rate.
 The Labor Force Participation Rate was unchanged at 62.7% in September, from 62.7% in August. This is the percentage of the working age population in the labor force.
 The Employment-Population ratio increased to 60.2% from 60.0% in August (blue line).
I'll post the 25 to 54 age group employment-population ratio graph later.
 The fourth graph shows the unemployment rate.
 The unemployment rate decreased to 4.1% in September from 4.2% in August.
This was well above consensus expectations, and July and August payrolls were revised up by 72,000 jobs, combined.
A strong report. I'll have more later ...
Thursday, October 03, 2024
Friday: Employment Report
by Calculated Risk on 10/03/2024 07:33:00 PM
 Note: Mortgage rates are from MortgageNewsDaily.com and are for top tier scenarios.
Friday:
• At 8:30 AM ET, 8:30 AM: Employment Report for September. The consensus is for 145,000 jobs added, and for the unemployment rate to be unchanged at 4.2%.
September Employment Preview
by Calculated Risk on 10/03/2024 03:27:00 PM
On Friday at 8:30 AM ET, the BLS will release the employment report for September. The consensus is for 145,000 jobs added, and for the unemployment rate to be unchanged at 4.2%.
There were 142,000 jobs added in August, and the unemployment rate was at 4.2%.
From BofA:
Although the labor market has been soft, low jobless claims suggest that the September employment report should be decent. We forecast a 150k increase in nonfarm payrolls, compared to 142k in August ... We look for the unemployment rate to remain unchanged at 4.2%From Goldman Sachs:
emphasis added
We estimate nonfarm payrolls rose by 165k in September, above consensus of +150k ... We estimate that the unemployment rate was unchanged on a rounded basis at 4.2%, in line with consensus.• ADP Report: The ADP employment report showed 143,000 private sector jobs were added in September. This was above consensus forecasts and suggests job gains above consensus expectations, however, in general, ADP hasn't been very useful in forecasting the BLS report.
• ISM Surveys: Note that the ISM indexes are diffusion indexes based on the number of firms hiring (not the number of hires). The ISM® manufacturing employment index decreased to 43.9%, down from 46.0% the previous month. This would suggest about 50,000 jobs lost in manufacturing. The ADP report indicated 2,000 manufacturing jobs added in September.
The ISM® services employment index decreased to 48.1%, from 50.1%. This would suggest 20,000 jobs added in the service sector. Combined this suggests 30,000 jobs lost in September, far below consensus expectations. (Note: The ISM surveys have been way off recently)
• Unemployment Claims: The weekly claims report showed fewer initial unemployment claims during the reference week at 222,000 in September compared to 233,000 in August. This suggests fewer layoffs in September compared to August.
• Conclusion: My guess is employment gains will be below consensus expectations.
Realtor.com Reports Active Inventory Up 31.9% YoY
by Calculated Risk on 10/03/2024 02:42:00 PM
What this means: On a weekly basis, Realtor.com reports the year-over-year change in active inventory and new listings. On a monthly basis, they report total inventory. For September, Realtor.com reported inventory was up 34.0% YoY, but still down 23.2% compared to the 2017 to 2019 same month levels.
Now - on a weekly basis - inventory is up 31.9% YoY.
Realtor.com has monthly and weekly data on the existing home market. Here is their weekly report: Weekly Housing Trends View—Data for Week Ending Sept. 28, 2024 Here is a graph of the year-over-year change in inventory according to realtor.com.
Inventory was up year-over-year for the 46th consecutive week.
Realtor.com has monthly and weekly data on the existing home market. Here is their weekly report: Weekly Housing Trends View—Data for Week Ending Sept. 28, 2024
• Active inventory increased, with for-sale homes 31.9% above year-ago levels
For the 47th consecutive week dating to November 2023, the number of listings for sale has grown year over year, and this week continues a string of growth rates in the mid-30% range that started in April. There were more homes for sale this week than in any week since January 2020, pre-pandemic. Much of the inventory buildup is due to more seller activity than buyer activity, but falling mortgage rates could mean more buyers enter the market in the coming weeks.
• New listings—a measure of sellers putting homes up for sale—jumped 1.7% this week compared with a year ago
The number of new listings has continued to increase, though at a slower pace. This slowdown isn’t entirely surprising, as a rate cut has been widely anticipated, eager sellers may have already acted by listing their homes in the weeks leading up to the Fed’s announcement. Looking ahead, with another rate cut expected before the end of 2024, we anticipate that more sellers will feel “unlocked,” as the prevailing mortgage rates come into closer alignment with their current rates.
 Here is a graph of the year-over-year change in inventory according to realtor.com.
 Inventory was up year-over-year for the 46th consecutive week.
However, inventory is still historically low.
New listings remain below typical pre-pandemic levels.


