 RSS Feed
 by Calculated Risk on 9/10/2024 01:52:00 PM
Tuesday, September 10, 2024
Update: Lumber Prices Unchanged YoY
Here is another monthly update on lumber prices.
SPECIAL NOTE: The CME group discontinued the Random Length Lumber Futures contract on May 16, 2023. I switched to a physically-delivered Lumber Futures contract that was started in August 2022.
Unfortunately, this impacts long term price comparisons since the new contract was priced about 24% higher than the old random length contract for the period when both contracts were available.
This graph shows CME random length framing futures through last August (blue), and the new physically-delivered Lumber Futures (LBR) contract starting in August 2022 (Red).
 Click on graph for larger image.
We didn't see a significant runup in the Spring period of 2023 or 2024 due to the housing slowdown.
This graph shows CME random length framing futures through last August (blue), and the new physically-delivered Lumber Futures (LBR) contract starting in August 2022 (Red).
LBR is currently at $505 per 1000 board feet, up slightly from a year ago.
 Click on graph for larger image.
There is somewhat of a seasonal demand for lumber, and lumber prices frequently peak in the first half of the year.
We didn't see a significant runup in the Spring period of 2023 or 2024 due to the housing slowdown.
Leading Index for Commercial Real Estate Increased 3% in August
by Calculated Risk on 9/10/2024 11:22:00 AM
From Dodge Data Analytics: Dodge Momentum Index Rises 3% in August
The Dodge Momentum Index (DMI), issued by Dodge Construction Network, increased 2.9% in August to 220.4 (2000=100) from the revised July reading of 214.2. Over the month, commercial planning expanded 1.9% and institutional planning improved 5.7%.
“Owners and developers continued to prime the planning queue in August, ahead of next year’s anticipated stronger market conditions,” stated Sarah Martin, associate director of forecasting at Dodge Construction Network. “With the Fed’s September rate cut all but finalized, the influence of selective lending standards and inflation should moderate next year, alongside a modest upgrade to consumer demand. As a result, stronger planning activity was widespread in August, with most nonresidential sectors seeing growth.”
Commercial planning saw another month of broad-based improvements. After slowing down in recent years, warehouse projects have gained momentum over the last three months. Hotels and retail planning have been steadily expanding as well. Data centers continued to dominate large project activity, but the rate at which planning projects entered the queue in August moderated after several months of very strong growth. On the institutional side, healthcare was the primary driver of this past month’s expansion, followed by recreational planning. In August, the DMI was 31% higher than in August of 2023. The commercial segment was up 42% from year-ago levels, while the institutional segment was up 8% over the same period.
...
The DMI is a monthly measure of the value of nonresidential building projects going into planning, shown to lead construction spending for nonresidential buildings by a full year.
emphasis added
 Click on graph for larger image.
This graph shows the Dodge Momentum Index since 2002. The index was at 220.4 in August, up from 214.2 the previous month.
According to Dodge, this index leads "construction spending for nonresidential buildings by a full year". This index suggests a slowdown in 2024 and early 2025, but a pickup in mid-2025.
Commercial construction is typically a lagging economic indicator.
ICE Mortgage Monitor: House Price Growth Slows, Inventory Surges in Florida and Texas
by Calculated Risk on 9/10/2024 08:22:00 AM
Today, in the Real Estate Newsletter: ICE Mortgage Monitor: House Price Growth Slows, Inventory Surges in Florida and Texas
Brief excerpt:
The local data I track is indicating that Florida and Texas inventory is above normal, whereas inventory is still low in most of the country.
• Every major market has more inventory for sale that at the same time last year, with the largest improvements in the state of Florida, along with individual markets, including Denver, Seattle, and parts of Texas
• More than 1 in 5 markets are now back to, or above, 2017-2019 inventory levels, with markets like Lakeland, Austin, San Antonio, Denver, and Palm Bay all having at least 25% more homes for sale than typical for this time of year

Monday, September 09, 2024
Tuesday: Misc
by Calculated Risk on 9/09/2024 07:13:00 PM
 From Matthew Graham at Mortgage News Daily: Mortgage Rates Holding Near Long-Term Lows to Start New Week
The average lender's top tier 30yr fixed rate fell to the lowest level since April 2023 last week. That's down more than 1.25% over the past 5 months. ... Today brought a significantly smaller improvement, but an improvement on a long-term low technically makes another long-term low.[30 year fixed 6.55%]Tuesday:
emphasis added
• At 6:00 AM ET, NFIB Small Business Optimism Index for August.
• At 8:00 AM, Corelogic House Price index for July
1st Look at Local Housing Markets in August
by Calculated Risk on 9/09/2024 11:30:00 AM
Today, in the Calculated Risk Real Estate Newsletter: 1st Look at Local Housing Markets in August
A brief excerpt:
NOTE: The tables for active listings, new listings and closed sales all include a comparison to August 2019 for each local market (some 2019 data is not available).There is much more in the article.
This is the first look at several early reporting local markets in August. I’m tracking over 40 local housing markets in the US. Some of the 40 markets are states, and some are metropolitan areas. I’ll update these tables throughout the month as additional data is released.
Closed sales in August were mostly for contracts signed in June and July when 30-year mortgage rates averaged 6.92% and 6.85%, respectively (Freddie Mac PMMS).
...
In August, sales in these markets were up 6.6% YoY. Last month, in July, these same markets were up 5.8% year-over-year Not Seasonally Adjusted (NSA).
Important: There was one fewer working day in August 2024 compared to August 2023 (22 vs 23), so seasonally adjusted sales up be up more than NSA sales. Last month, in July 2024, there were two more working days compared to July 2023 (22 vs 20), so seasonally adjusted sales were lower than the NSA data suggests.
Sales in all of these markets are down significantly compared to July 2019.
...
This was just a several early reporting markets. Many more local markets to come!

Wholesale Used Car Prices Increased in August; Down 3.9% Year-over-year
by Calculated Risk on 9/09/2024 09:08:00 AM
From Manheim Consulting today: Wholesale Used-Vehicle Prices Increased in August
Wholesale used-vehicle prices (on a mix, mileage, and seasonally adjusted basis) were higher in August compared to July. The Manheim Used Vehicle Value Index (MUVVI) rose to 203.9, a decline of 3.9% from a year ago. The seasonal adjustment to the index mitigated the impact on the month, resulting in values that rose 1.2% month over month. The non-adjusted price in August increased by 2.2% compared to July, moving the unadjusted average price down 4.6% year over year.
emphasis added
 Click on graph for larger image.
This index from Manheim Consulting is based on all completed sales transactions at Manheim’s U.S. auctions.
The Manheim index suggests used car prices increased in August (seasonally adjusted) and were down 3.9% year-over-year (YoY).
Housing Sept 9th Weekly Update: Inventory Down 0.1% Week-over-week, Up 38.0% Year-over-year
by Calculated Risk on 9/09/2024 08:17:00 AM
Altos reports that active single-family inventory was down 0.1% week-over-week. Inventory is now up 42.4% from the February seasonal bottom.
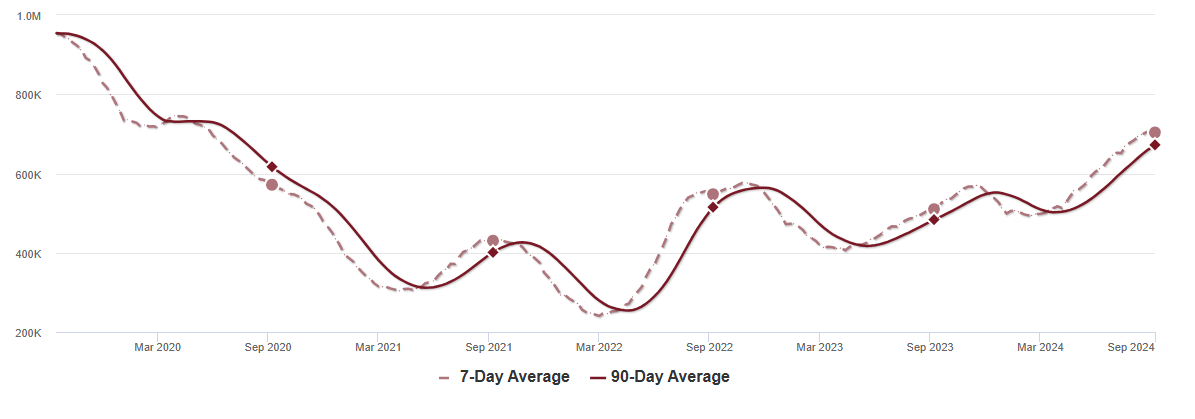 Click on graph for larger image.
This inventory graph is courtesy of Altos Research.
As of September 6th, inventory was at 704 thousand (7-day average), compared to 704 thousand the prior week.
It is possible inventory is at or close to the peak for the year (this would be normal timing pre-pandemic).
The second graph shows the seasonal pattern for active single-family inventory since 2015.

The red line is for 2024. The black line is for 2019.
Inventory was up 38.0% compared to the same week in 2023 (last week it was up 38.2%), and down 25.7% compared to the same week in 2019 (last week it was down 26.6%).
Back in June 2023, inventory was down almost 54% compared to 2019, so the gap to more normal inventory levels is slowly closing.
Mike Simonsen discusses this data regularly on Youtube.
Sunday, September 08, 2024
Sunday Night Futures
by Calculated Risk on 9/08/2024 07:33:00 PM
Weekend:
• Schedule for Week of September 8, 2024
• House Price Weekend: Case-Shiller: National House Price Index Up 5.4% year-over-year in June
• Inflation Adjusted House Prices 1.6% Below 2022 Peak
• Freddie Mac House Price Index Increased Slightly in July; Up 4.4% Year-over-year
Monday:
• No major economic releases scheduled.
From CNBC: Pre-Market Data and Bloomberg futures S&P 500 are down 4 and DOW futures are down 32 (fair value).
Oil prices were up mostly unchanged over the last week with WTI futures at $67.67 per barrel and Brent at $71.06 per barrel. A year ago, WTI was at $88, and Brent was at $92 - so WTI oil prices are down about 24% year-over-year.
Here is a graph from Gasbuddy.com for nationwide gasoline prices. Nationally prices are at $3.24 per gallon. A year ago, prices were at $3.80 per gallon, so gasoline prices are down $0.56 year-over-year.
Freddie Mac House Price Index Increased Slightly in July; Up 4.4% Year-over-year
by Calculated Risk on 9/08/2024 12:15:00 PM
Today, in the Calculated Risk Real Estate Newsletter: Freddie Mac House Price Index Increased Slightly in July; Up 4.4% Year-over-year
A brief excerpt:
Freddie Mac reported that its “National” Home Price Index (FMHPI) increased 0.05% month-over-month on a seasonally adjusted (SA) basis in June. On a year-over-year basis, the National FMHPI was up 4.4% in July, down from up 5.2% YoY in June. The YoY increase peaked at 19.1% in July 2021, and for this cycle, bottomed at up 0.9% YoY in May 2023. ...
As of July, 17 states and D.C. were below their previous peaks, Seasonally Adjusted. The largest seasonally adjusted declines from the recent peak were in Idaho (-4.2%), Arizona (-1.9%), Arkansas (-1.8), Florida (-1.6%), Texas (-1.3%), and Colorado (-1.1%).
For cities (Core-based Statistical Areas, CBSA), here are the 30 cities with the largest declines from the peak, seasonally adjusted. Austin continues to be the worst performing city. However, 10 of the 30 worst performing cities are now in Florida!

There is much more in the article.
Inflation Adjusted House Prices 1.6% Below 2022 Peak; Price-to-rent index is 7.7% below 2022 peak
by Calculated Risk on 9/08/2024 10:52:00 AM
Today, in the Calculated Risk Real Estate Newsletter: Inflation Adjusted House Prices 1.9% Below 2022 Peak
Excerpt:
It has been over 18 years since the bubble peak. In the June Case-Shiller house price index released last week, the seasonally adjusted National Index (SA), was reported as being 73% above the bubble peak in 2006. However, in real terms, the National index (SA) is about 11% above the bubble peak (and historically there has been an upward slope to real house prices). The composite 20, in real terms, is 2% above the bubble peak.
People usually graph nominal house prices, but it is also important to look at prices in real terms. As an example, if a house price was $300,000 in January 2010, the price would be $432,000 today adjusted for inflation (44% increase). That is why the second graph below is important - this shows "real" prices.
The third graph shows the price-to-rent ratio, and the fourth graph is the affordability index. The last graph shows the 5-year real return based on the Case-Shiller National Index.
...
The second graph shows the same two indexes in real terms (adjusted for inflation using CPI).
In real terms (using CPI), the National index is 1.6% below the recent peak, and the Composite 20 index is 2.0% below the recent peak in 2022. Both indexes increased in June in real terms boosted by the slight month-over-month decline in inflation in June.

Saturday, September 07, 2024
Case-Shiller: National House Price Index Up 5.4% year-over-year in June; FHFA House Price Index Declined Slightly month-over-month in June
by Calculated Risk on 9/07/2024 06:50:00 PM
Today, in the Calculated Risk Real Estate Newsletter: House Price Weekend: Case-Shiller: National House Price Index Up 5.4% year-over-year in June
Excerpt:
S&P/Case-Shiller released the monthly Home Price Indices for June ("June" is a 3-month average of April, May and June closing prices). June closing prices include some contracts signed in February, so there is a significant lag to this data. Here is a graph of the month-over-month (MoM) change in the Case-Shiller National Index Seasonally Adjusted (SA).
The MoM increase in the seasonally adjusted (SA) Case-Shiller National Index was at 0.16%. This was the seventeenth consecutive MoM increase, but this was the smallest MoM increase in the last 16 months.
On a seasonally adjusted basis, prices increased month-to-month in 15 of the 20 Case-Shiller cities. Seasonally adjusted, San Francisco has fallen 6.8% from the recent peak, Phoenix is down 4.5% from the peak, Seattle down 4.0%, and Portland is down 3.4%.

There is much more in the article.
Schedule for Week of September 8, 2024
by Calculated Risk on 9/07/2024 08:11:00 AM
The key economic report this week is the August Consumer Price Index (CPI).
No major economic releases scheduled.
6:00 AM: NFIB Small Business Optimism Index for August.
8:00 AM: Corelogic House Price index for July
7:00 AM ET: The Mortgage Bankers Association (MBA) will release the results for the mortgage purchase applications index.
8:30 AM: The Consumer Price Index for August from the BLS. The consensus is for a 0.2% increase in CPI, and a 0.2% increase in core CPI. The consensus is for CPI to be up 2.6% year-over-year (down from 2.9% in July) and core CPI to be up 3.2% YoY (unchanged from 3.2% in July).
8:30 AM: The initial weekly unemployment claims report will be released. The consensus is for 225 thousand initial claims, down from 227 thousand last week.
8:30 AM: The Producer Price Index for August from the BLS. The consensus is for a 0.2% increase in PPI, and a 0.2% increase in core PPI.
12:00 PM: Q2 Flow of Funds Accounts of the United States from the Federal Reserve.
10:00 AM: University of Michigan's Consumer sentiment index (Preliminary for September).
Friday, September 06, 2024
September 6th COVID Update: Wastewater Measure Has Peaked
by Calculated Risk on 9/06/2024 07:31:00 PM
 Note: Mortgage rates are from MortgageNewsDaily.com and are for top tier scenarios.
For deaths, I'm currently using 4 weeks ago for "now", since the most recent three weeks will be revised significantly.
Note: "Effective May 1, 2024, hospitals are no longer required to report COVID-19 hospital admissions, hospital capacity, or hospital occupancy data." So I'm no longer tracking hospitalizations.
| COVID Metrics | ||||
|---|---|---|---|---|
| Now | Week Ago | Goal | ||
| Deaths per Week🚩 | 971 | 891 | ≤3501 | |
| 1my goals to stop weekly posts, 🚩 Increasing number weekly for Deaths ✅ Goal met. | ||||
 Click on graph for larger image.
This graph shows the weekly (columns) number of deaths reported.
Although weekly deaths met the original goal to stop posting, I'm going to continue to post now that deaths are above the goal again.
Weekly deaths are triple the low of 302 in early June.
 This appears to be a leading indicator for COVID hospitalizations and deaths.
COVID in wastewater turned down in most areas recently and this suggests weekly deaths will likely decline in a few weeks (until the winter surge).
Q3 GDP Tracking: Low-to-Mid 2%
by Calculated Risk on 9/06/2024 06:17:00 PM
From BofA:
Since our last weekly publication, the 3Q GDP tracking estimate went down three tenths to 2.3% q/q saar while our 2Q GDP tracking estimate remains unchanged at 3.0% q/q saar since the second official estimate. [Sept 6th estimate]From Goldman:
emphasis added
The details of the trade balance report were somewhat softer than our previous assumptions while the details of the factory orders report were roughly in line with our expectations. On net, we lowered our Q3 GDP tracking estimate by 0.2pp to +2.5% (quarter-over-quarter annualized) and left our Q3 domestic final sales forecast unchanged at 2.6%. [Sept 4th estimate]And from the Atlanta Fed: GDPNow
The GDPNow model estimate for real GDP growth (seasonally adjusted annual rate) in the third quarter of 2024 is 2.1 percent on September 4, up from 2.0 percent on September 3. After this morning’s releases from the US Census Bureau, an increase in the nowcast of third-quarter real gross private domestic investment growth from -0.6 percent to 0.0 percent was slightly offset by a decrease in the nowcast of third-quarter real personal consumption expenditures growth from 3.3 percent to 3.2 percent. [Sept 4th estimate]
Catching Up: New Home Sales Increased to 739,000 Annual Rate in July
by Calculated Risk on 9/06/2024 12:03:00 PM
Today, in the Calculated Risk Real Estate Newsletter: Catching Up: New Home Sales Increased to 739,000 Annual Rate in July
Brief excerpt:
I'm back from Africa! I’ll be catching up on recent data over the next few days, and I’ll post some photos / videos from my trip.There is much more in the article.
...
Last week the Census Bureau reported New Home Sales in July were at a seasonally adjusted annual rate (SAAR) of 739 thousand. The previous three months were revised up sharply, combined.
...
The next graph shows new home sales for 2023 and 2024 by month (Seasonally Adjusted Annual Rate). Sales in July 2024 were up 21.3% from July 2023.
New home sales, seasonally adjusted, have increased year-over-year in 15 of the last 16 months.

Comments on August Employment Report
by Calculated Risk on 9/06/2024 09:12:00 AM
The headline jobs number in the August employment report was below expectations, and June and July payrolls were revised down by 82,000 combined. The participation rate and the employment population ratio were unchanged, and the unemployment rate decreased to 4.2%.
Construction employment increased 34 thousand and is now 665 thousand above the pre-pandemic level.
Manufacturing employment decreased 24 thousand and is now 147 thousand above the pre-pandemic level.
Prime (25 to 54 Years Old) Participation
 Since the overall participation rate is impacted by both cyclical (recession) and demographic (aging population, younger people staying in school) reasons, here is the employment-population ratio for the key working age group: 25 to 54 years old.
The 25 to 54 years old participation rate decreased in August to 83.9% from 84.0% in July.
The 25 to 54 employment population ratio was unchanged at 80.9% from 80.9% the previous month.
Both are above pre-pandemic levels and near the highest level this millennium.
Average Hourly Wages
 The graph shows the nominal year-over-year change in "Average Hourly Earnings" for all private employees from the Current Employment Statistics (CES).
Average Hourly Wages
 The graph shows the nominal year-over-year change in "Average Hourly Earnings" for all private employees from the Current Employment Statistics (CES).
 There was a huge increase at the beginning of the pandemic as lower paid employees were let go, and then the pandemic related spike reversed a year later.
Wage growth has trended down after peaking at 5.9% YoY in March 2022 and was at 3.8% YoY in August.
Wage growth has trended down after peaking at 5.9% YoY in March 2022 and was at 3.8% YoY in August.
Part Time for Economic Reasons
 From the BLS report:
"The number of people employed part time for economic reasons was little changed at 4.8 million in August. This measure is up from 4.2 million a year earlier. These individuals would have preferred full-time employment but were working part time because their hours had been reduced or they were unable to find full-time jobs."The number of persons working part time for economic reasons increased in August to 4.83 million from 4.57 million in July. This is above the pre-pandemic levels.
These workers are included in the alternate measure of labor underutilization (U-6) that increased to 7.9% from 7.8% in the previous month. This is down from the record high in April 2020 of 23.0% and up from the lowest level on record (seasonally adjusted) in December 2022 (6.5%). (This series started in 1994). This measure is above the 7.0% level in February 2020 (pre-pandemic).
Unemployed over 26 Weeks
 This graph shows the number of workers unemployed for 27 weeks or more.
 According to the BLS, there are 1.533 million workers who have been unemployed for more than 26 weeks and still want a job, essentialy unchanged from 1.535 million the previous month.
This is down from post-pandemic high of 4.174 million, and up from the recent low of 1.050 million.
This is above pre-pandemic levels.
Job Streak
Summary:
The headline jobs number in the August employment report was below expectations, and June and July payrolls were revised down by 82,000 combined. The participation rate and the employment population ratio were unchanged, and the unemployment rate decreased to 4.2%.
This is above pre-pandemic levels.
Job Streak
Through August 2024, the employment report indicated positive job growth for 44 consecutive months, putting the current streak in 5th place of the longest job streaks in US history (since 1939). It appears this streak will survive the annual benchmark revision (that will revise down job growth).
| Headline Jobs, Top 10 Streaks | ||
|---|---|---|
| Year Ended | Streak, Months | |
| 1 | 2019 | 100 |
| 2 | 1990 | 48 |
| 3 | 2007 | 46 |
| 4 | 1979 | 45 |
| 5 | 20241 | 44 |
| 6 tie | 1943 | 33 |
| 6 tie | 1986 | 33 |
| 6 tie | 2000 | 33 |
| 9 | 1967 | 29 |
| 10 | 1995 | 25 |
| 1Currrent Streak | ||
Summary:
The headline jobs number in the August employment report was below expectations, and June and July payrolls were revised down by 82,000 combined. The participation rate and the employment population ratio were unchanged, and the unemployment rate decreased to 4.2%.
A weaker than expected report, and the three-month average employment growth has slowed to 116 per month. The unemployment rate is up from a low of 3.4% in early 2023 to 4.2% in August (although down slightly from July).
August Employment Report: 142 thousand Jobs, 4.2% Unemployment Rate
by Calculated Risk on 9/06/2024 08:30:00 AM
From the BLS: Employment Situation
Total nonfarm payroll employment increased by 142,000 in August, and the unemployment rate changed little at 4.2 percent, the U.S. Bureau of Labor Statistics reported today. Job gains occurred in construction and health care.
...
The change in total nonfarm payroll employment for June was revised down by 61,000, from +179,000 to +118,000, and the change for July was revised down by 25,000, from +114,000 to +89,000. With these revisions, employment in June and July combined is 86,000 lower than previously reported.
emphasis added
 Click on graph for larger image.
The first graph shows the jobs added per month since January 2021.
Total payrolls increased by 142 thousand in August. Private payrolls increased by 118 thousand, and public payrolls increased 24 thousand.
Payrolls for June and July were revised down 86 thousand, combined.
Payrolls for June and July were revised down 86 thousand, combined.
 The second graph shows the year-over-year change in total non-farm employment since 1968.
In August, the year-over-year change was 2.36 million jobs. Employment was up solidly year-over-year (Although the annual benchmark revision will lower the year-over-year change).
The third graph shows the employment population ratio and the participation rate.
 The Labor Force Participation Rate was unchanged at 62.7% in August, from 62.7% in July. This is the percentage of the working age population in the labor force.
 The Employment-Population ratio was unchanged at 60.0% from 60.0% in July (blue line).
I'll post the 25 to 54 age group employment-population ratio graph later.
 The fourth graph shows the unemployment rate.
 The unemployment rate decreased to 4.2% in August from 4.3% in July.
This was below consensus expectations, and June and July payrolls were revised down by 82,000 combined.
Thursday, September 05, 2024
Friday: Employment Report
by Calculated Risk on 9/05/2024 07:09:00 PM
 Note: Mortgage rates are from MortgageNewsDaily.com and are for top tier scenarios.
Friday:
• At 8:30 AM ET, Employment Report for August. The consensus is for 164,000 jobs added, and for the unemployment rate to decreased to 4.2%.
August Employment Preview
by Calculated Risk on 9/05/2024 03:47:00 PM
On Friday at 8:30 AM ET, the BLS will release the employment report for August. The consensus is for 164,000 jobs added, and for the unemployment rate to decreased to 4.2%.
There were 114,000 jobs added in July, and the unemployment rate was at 4.3%.
From Goldman Sachs:
We are below consensus on payroll growth at 155k but in line on the unemployment rate at 4.2%.• ADP Report: The ADP employment report showed 99,000 private sector jobs were added in August. This was below consensus forecasts and suggests job gains below consensus expectations, however, in general, ADP hasn't been very useful in forecasting the BLS report.
We are below consensus on payroll growth because August payrolls have exhibited a consistent negative bias in initial prints over the last decade, Big Data indicators continued to slow, and the immigration boost to labor force and employment growth should be slowing (although still well above trend). On the positive side, we should see some rebound from severe weather in July.
We expect the unemployment rate fell 0.1pp on a rounded basis to 4.2%, a low hurdle from an unrounded 4.25% in July, reflecting the reversal of some of the temporary layoffs in July linked to summer auto plant retooling shutdowns or extreme heat.
emphasis added
• ISM Surveys: Note that the ISM indexes are diffusion indexes based on the number of firms hiring (not the number of hires). The ISM® manufacturing employment index increased to 46.0%, up from 43.4% the previous month. This would suggest about 40,000 jobs lost in manufacturing. The ADP report indicated 8,000 manufacturing jobs lost in August.
The ISM® services employment index decreased to 50.2%, from 51.1%. This would suggest 80,000 jobs added in the service sector. Combined this suggests 40,000 jobs added in August, far below consensus expectations.
• Unemployment Claims: The weekly claims report showed fewer initial unemployment claims during the reference week at 233,000 in July compared to 245,000 in July. This suggests fewer layoffs in August compared to July.
• Conclusion: My guess is employment gains will be below consensus expectations.
Calculated Risk Returns! Existing Home Sales Increased to 3.95 million SAAR in July
by Calculated Risk on 9/05/2024 12:16:00 PM
Today, in the CalculatedRisk Real Estate Newsletter: Calculated Risk Returns! Existing Home Sales Increased to 3.95 million SAAR in July
Excerpt:
I'm back from Africa! I’ll be catching up on recent data over the next week, and I’ll post some photos / videos from my trip.
...
Sales Year-over-Year and Not Seasonally Adjusted (NSA)
The fourth graph shows existing home sales by month for 2023 and 2024.
Sales declined 2.5% year-over-year compared to July 2023. This was the thirty-fifth consecutive month with sales down year-over-year.


