 RSS Feed
 by Calculated Risk on 7/07/2024 06:46:00 PM
Sunday, July 07, 2024
Sunday Night Futures
Weekend:
• Schedule for Week of July 7, 2024
Monday:
• No major economic releases scheduled.
From CNBC: Pre-Market Data and Bloomberg futures S&P 500 are down 9 and DOW futures are down 59 (fair value).
Oil prices were higher over the last week with WTI futures at $83.16 per barrel and Brent at $86.54 per barrel. A year ago, WTI was at $74, and Brent was at $79 - so WTI oil prices are up about 12% year-over-year.
Here is a graph from Gasbuddy.com for nationwide gasoline prices. Nationally prices are at $3.47 per gallon. A year ago, prices were at $3.51 per gallon, so gasoline prices are down $0.04 year-over-year.
Moody's: Retail Vacancy Rate Unchanged in Q2
by Calculated Risk on 7/07/2024 08:21:00 AM
Note: I covered apartments and offices in the newsletter: Moody's: Apartment Vacancy Rate Unchanged in Q2; Office Vacancy Rate at New Record High
From Moody’s Analytics economists: Apartment Demand Slowly Catching Up, Office Stress Continued to Manifest, Retail Resilient Despite Bankruptcies, And Industrial Cools Down
The Q2 2024 data maintained its familiar trend with the retail vacancy rate holding steady at 10.4%. Both asking and effective rents experienced a marginal increase of 0.2% to $21.79 and $19.07 per square foot respectively. The second quarter consumer spending fell short of expectations: after a 0.2% decline in April, retail sales in May were only up by 0.1%, not meeting the anticipated 0.3% increase. As low-income consumers continued to feel the pinch, those in the middle are now encountering financial challenges while high earners pulled back on luxury item purchases. However, spending has not ground to a halt: consumers plan to travel and attend concerts this summer, indicating a shift in preference towards experiences over goods.
The current trends signal an expectation of relatively subdued construction activity for the rest of the year. In the absence of significant new developments, current shopping and neighborhood centers have taken advantage of companies applying the smaller-yet-smarter model to fill their vacant anchors. This approach involves large retail chains offering a limited selection of their products in more compact locations. The business rationale is to address the decline in revenues by reducing operational costs through lower rental expenses, fewer staff members, and a reduced inventory, culminating in decreased overall overhead and, consequently, higher profit margins. This strategy is helping retail landlords fill vacancies caused by recent bankruptcies and attributing to the stabilized vacancy rate.
 This graph shows the strip mall vacancy rate starting in 1980 (prior to 2000 the data is annual).
 Back in the '80s, there was overbuilding in the mall sector even as the vacancy rate was rising. This was due to the very loose commercial lending that led to the S&L crisis.
In the mid-'00s, mall investment picked up as mall builders followed the "roof tops" of the residential boom (more loose lending). This led to the vacancy rate moving higher even before the recession started. Then there was a sharp increase in the vacancy rate during the recession and financial crisis.
In the mid-'00s, mall investment picked up as mall builders followed the "roof tops" of the residential boom (more loose lending). This led to the vacancy rate moving higher even before the recession started. Then there was a sharp increase in the vacancy rate during the recession and financial crisis.
Recently the vacancy rate has held steady at a high level as online shopping continues to impact brick and mortar stores.
Saturday, July 06, 2024
Real Estate Newsletter Articles this Week: Office Vacancy Rate at New Record High
by Calculated Risk on 7/06/2024 02:11:00 PM
At the Calculated Risk Real Estate Newsletter this week:
 Click on graph for larger image.
• FHFA’s National Mortgage Database: Outstanding Mortgage Rates, LTV and Credit Scores
• Moody's: Apartment Vacancy Rate Unchanged in Q2; Office Vacancy Rate at New Record High
• ICE Mortgage Monitor: Existing Home Inventory Surges in Florida and Texas
• Asking Rents Mostly Unchanged Year-over-year
• Final Look at Local Housing Markets in May and a Look Ahead to June Sales
This is usually published 4 to 6 times a week and provides more in-depth analysis of the housing market.
Schedule for Week of July 7, 2024
by Calculated Risk on 7/06/2024 08:11:00 AM
The key report this week is June CPI.
Fed Chair Powell testifies on the Semiannual Monetary Policy Report to Congress.
No major economic releases scheduled.
6:00 AM ET: NFIB Small Business Optimism Index for June.
10:00 AM: Testimony, Fed Chair Jerome Powell, Semiannual Monetary Policy Report to Congress, Before the U.S. Senate Committee on Banking, Housing, and Urban Affairs
7:00 AM ET: The Mortgage Bankers Association (MBA) will release the results for the mortgage purchase applications index.
10:00 AM: Testimony, Fed Chair Jerome Powell, Semiannual Monetary Policy Report to Congress, Before the U.S. House Financial Services Committee
8:30 AM: The Consumer Price Index for June from the BLS. The consensus is for a 0.1% increase in CPI, and a 0.2% increase in core CPI. The consensus is for CPI to be up 3.1% year-over-year and core CPI to be up 3.4% YoY.
8:30 AM: The initial weekly unemployment claims report will be released. The consensus is for 242 thousand initial claims, up from 238 thousand last week.
8:30 AM: The Producer Price Index for June from the BLS. The consensus is for a 0.1% increase in PPI, and a 0.2% increase in core PPI.
10:00 AM: University of Michigan's Consumer sentiment index (Preliminary for July).
Friday, July 05, 2024
July 5th COVID Update: Wastewater Measure Increasing Sharply
by Calculated Risk on 7/05/2024 08:29:00 PM
 Note: Mortgage rates are from MortgageNewsDaily.com and are for top tier scenarios.
For deaths, I'm currently using 4 weeks ago for "now", since the most recent three weeks will be revised significantly.
Note: "Effective May 1, 2024, hospitals are no longer required to report COVID-19 hospital admissions, hospital capacity, or hospital occupancy data." So I'm no longer tracking hospitalizations.
| COVID Metrics | ||||
|---|---|---|---|---|
| Now | Week Ago | Goal | ||
| Deaths per Week✅ | 283 | 306 | ≤3501 | |
| 1my goals to stop weekly posts, 🚩 Increasing number weekly for Deaths ✅ Goal met. | ||||
 Click on graph for larger image.
This graph shows the weekly (columns) number of deaths reported.
Weekly deaths have declined from the recent peak of 2,561 and are now below the previous pandemic low of 491 last July. This week was at the pandemic low.
 This appears to be a leading indicator for COVID hospitalizations and deaths.
COVID in wastewater is increasing - especially in the West and South - and unfortunately this suggest weekly deaths will likely start increasing again.
Realtor.com Reports Active Inventory Up 38.1% YoY
by Calculated Risk on 7/05/2024 01:55:00 PM
What this means: On a weekly basis, Realtor.com reports the year-over-year change in active inventory and new listings. On a monthly basis, they report total inventory. For April, Realtor.com reported inventory was up 35.2% YoY, but still down almost 34% compared to April 2017 to 2019 levels.
Now - on a weekly basis - inventory is up 38.1% YoY.
Realtor.com has monthly and weekly data on the existing home market. Here is their weekly report: Weekly Housing Trends View—Data for Week Ending June 29, 2024 Here is a graph of the year-over-year change in inventory according to realtor.com.
Inventory was up year-over-year for the 34th consecutive week.
Realtor.com has monthly and weekly data on the existing home market. Here is their weekly report: Weekly Housing Trends View—Data for Week Ending June 29, 2024
• Active inventory increased, with for-sale homes 38.1% above year-ago levels
For the 34th week in a row, the number of for-sale homes grew compared with one year ago. This past week, the inventory of homes for sale grew by 38.1% compared with last year, increasing the gap compared with recent weeks and notching the largest annual increase since April 2023.
Despite nearly eight months of building inventory, buyers still see more than 30% fewer homes for sale compared with before the pandemic. Limited home supply has kept upward pressure on home prices, which, combined with still-high mortgage rates, means many buyers remain on the sidelines.
• New listings–a measure of sellers putting homes up for sale–were up this week, by 10.8% from one year ago
Seller activity picked up momentum this week. New listing activity increased annually, climbing by more than in any week back to late April. Recently falling mortgage rates might be encouraging more homeowners to list their homes for sale.
 Here is a graph of the year-over-year change in inventory according to realtor.com.
 Inventory was up year-over-year for the 34th consecutive week.
However, inventory is still historically low.
New listings remain below typical pre-pandemic levels although up year-over-year.
Moody's: Apartment Vacancy Rate Unchanged in Q2; Office Vacancy Rate at New Record High
by Calculated Risk on 7/05/2024 10:52:00 AM
Today, in the Calculated Risk Real Estate Newsletter: Moody's: Apartment Vacancy Rate Unchanged in Q2; Office Vacancy Rate at New Record High
A brief excerpt:
From Moody’s:There is much more in the article.The office sector set a record vacancy rate at 20.1%, breaking the 20% barrier for the first time in history. The slow bleed occurring in the office sector has led to a steady rise in the vacancy rate as permanent shifts in working behavior have outlasted the initial wave of the pandemic four years ago. Q2’s record rate of 20.1% is up from 19.8% the previous quarter and represents the third straight record-breaking quarter beyond our previous historic peaks of 19.3% set in 1986 and 1991.Moody’s Analytics reported that the office vacancy rate was at 20.1% in Q2 2024, up from 19.8% in Q1 2024. This is a new record high, and above the 19.3% during the S&L crisis.

Comments on June Employment Report
by Calculated Risk on 7/05/2024 09:14:00 AM
The headline jobs number in the June employment report was above expectations, however April and May payrolls were revised down by 111,000 combined. The participation rate increased, the employment population ratio was unchanged, and the unemployment rate increased to 4.1%.
Construction employment increased 27 thousand and is now 630 thousand above the pre-pandemic level.
Manufacturing employment decreased 8 thousand and is now 170 thousand above the pre-pandemic level.
Prime (25 to 54 Years Old) Participation
 Since the overall participation rate is impacted by both cyclical (recession) and demographic (aging population, younger people staying in school) reasons, here is the employment-population ratio for the key working age group: 25 to 54 years old.
The 25 to 54 years old participation rate increased in June to 83.7% from 83.6% in May to the highest level since 2001.
The 25 to 54 employment population ratio was unchanged at 80.8% from 80.8% the previous month.
Both are above pre-pandemic levels and near the highest level this millennium.
Average Hourly Wages
 The graph shows the nominal year-over-year change in "Average Hourly Earnings" for all private employees from the Current Employment Statistics (CES).
Average Hourly Wages
 The graph shows the nominal year-over-year change in "Average Hourly Earnings" for all private employees from the Current Employment Statistics (CES).
 There was a huge increase at the beginning of the pandemic as lower paid employees were let go, and then the pandemic related spike reversed a year later.
Wage growth has trended down after peaking at 5.9% YoY in March 2022 and was at 3.9% YoY in June.
Wage growth has trended down after peaking at 5.9% YoY in March 2022 and was at 3.9% YoY in June.
Part Time for Economic Reasons
 From the BLS report:
"The number of people employed part time for economic reasons, at 4.2 million, changed little in June. These individuals, who would have preferred full-time employment, were working part time because their hours had been reduced or they were unable to find full-time jobs."The number of persons working part time for economic reasons decreased in June to 4.22 million from 4.42 million in May. This is lower than pre-pandemic levels.
These workers are included in the alternate measure of labor underutilization (U-6) that was unchanged at 7.4% from 7.4% in the previous month. This is down from the record high in April 2020 of 23.0% and up from the lowest level on record (seasonally adjusted) in December 2022 (6.5%). (This series started in 1994). This measure is above the 7.0% level in February 2020 (pre-pandemic).
Unemployed over 26 Weeks
 This graph shows the number of workers unemployed for 27 weeks or more.
 According to the BLS, there are 1.515 million workers who have been unemployed for more than 26 weeks and still want a job, up from 1.350 million the previous month.
This is down from post-pandemic high of 4.174 million, and up from the recent low of 1.050 million.
This is above pre-pandemic levels.
Job Streak
Summary:
The headline jobs number in the June employment report was above expectations, however, April and May payrolls were revised down by 111,000 combined. The participation rate increased, the employment population ratio was unchanged, and the unemployment rate increased to 4.1%.
This is above pre-pandemic levels.
Job Streak
Through June 2024, the employment report indicated positive job growth for 42 consecutive months, putting the current streak in 5th place of the longest job streaks in US history (since 1939).
| Headline Jobs, Top 10 Streaks | ||
|---|---|---|
| Year Ended | Streak, Months | |
| 1 | 2019 | 100 |
| 2 | 1990 | 48 |
| 3 | 2007 | 46 |
| 4 | 1979 | 45 |
| 5 | 20241 | 42 |
| 6 tie | 1943 | 33 |
| 6 tie | 1986 | 33 |
| 6 tie | 2000 | 33 |
| 9 | 1967 | 29 |
| 10 | 1995 | 25 |
| 1Currrent Streak | ||
Summary:
The headline jobs number in the June employment report was above expectations, however, April and May payrolls were revised down by 111,000 combined. The participation rate increased, the employment population ratio was unchanged, and the unemployment rate increased to 4.1%.
Another decent report, however, the three-month average employment growth has slowed to 177 per month.
June Employment Report: 206 thousand Jobs, 4.1% Unemployment Rate
by Calculated Risk on 7/05/2024 08:30:00 AM
From the BLS: Employment Situation
Total nonfarm payroll employment increased by 206,000 in June, and the unemployment rate changed little at 4.1 percent, the U.S. Bureau of Labor Statistics reported today. Job gains occurred in government, health care, social assistance, and construction.
...
The change in total nonfarm payroll employment for April was revised down by 57,000, from +165,000 to +108,000, and the change for May was revised down by 54,000, from +272,000 to +218,000. With these revisions, employment in April and May combined is 111,000 lower than previously reported.
emphasis added
 Click on graph for larger image.
The first graph shows the jobs added per month since January 2021.
Total payrolls increased by 206 thousand in June. Private payrolls increased by 136 thousand, and public payrolls increased 70 thousand.
Payrolls for April and May were revised down 111 thousand, combined.
Payrolls for April and May were revised down 111 thousand, combined.
 The second graph shows the year-over-year change in total non-farm employment since 1968.
In June, the year-over-year change was 2.61 million jobs. Employment was up solidly year-over-year.
The third graph shows the employment population ratio and the participation rate.
 The Labor Force Participation Rate increased to 62.6% in June, from 62.5% in May. This is the percentage of the working age population in the labor force.
 The Employment-Population ratio was unchanged at 60.1% from 60.2% in May (blue line).
I'll post the 25 to 54 age group employment-population ratio graph later.
 The fourth graph shows the unemployment rate.
 The unemployment rate increased to 4.1% in June from 4.0% in May.
This was above consensus expectations; however, April and May payrolls were revised down by 111,000 combined.
Thursday, July 04, 2024
June Employment Preview
by Calculated Risk on 7/04/2024 09:47:00 AM
On Friday at 8:30 AM ET, the BLS will release the employment report for June. The consensus is for 180,000 jobs added, and for the unemployment rate to be unchanged at 4.0%.
There were 272,000 jobs added in May, and the unemployment rate was at 4.0%.
From Goldman Sachs:
Big Data measures ... indicate a soft pace of spring hiring, and we expect an additional drag from residual seasonality in the official payroll figures this Friday. We left our forecast for June nonfarm payroll unchanged at +140k (mom sa).From BofA:
emphasis added
We forecast nonfarm payrolls rose by a solid 200k in June, a 72k decline from the 272k print in May and about 50k lower than the trailing three-month average. ... A slight slowdown in hiring is likely to result in the unemployment rate remaining at 4.0, while wage growth moderates a tenth to 0.3% m/m.• ADP Report: The ADP employment report showed 150,000 private sector jobs were added in June. This was below consensus forecasts and suggests job gains below consensus expectations, however, in general, ADP hasn't been very useful in forecasting the BLS report.
• ISM Surveys: Note that the ISM indexes are diffusion indexes based on the number of firms hiring (not the number of hires). The ISM® manufacturing employment index decreased to 49.3%, down from 51.1% the previous month. This would suggest about 20,000 jobs lost in manufacturing. The ADP report indicated 5,000 manufacturing jobs lost in June.
The ISM® services employment index decreased to 46.1%, from 47.1%. This would suggest 30,000 jobs lost in the service sector. Combined this suggests 50,000 jobs lost in June, far below consensus expectations.
• Unemployment Claims: The weekly claims report showed more initial unemployment claims during the reference week at 239,000 in June compared to 216,000 in May. This suggests more layoffs in June compared to May.
• Conclusion: My guess is employment gains will be below consensus expectations.
Wednesday, July 03, 2024
"Mortgage Rates Move Lower"
by Calculated Risk on 7/03/2024 07:27:00 PM
 From Matthew Graham at Mortgage News Daily: Mortgage Rates Move Lower After Weak Service Sector Report
"Data dependent" is one of the most common phrases heard from the Federal Reserve these days when it comes to rate-setting policy. And while the Fed doesn't directly dictate mortgage rates, the bond market tends to trade the same data that the Fed cares about.Thursday:
Today's key report, the ISM Services index, isn't quite at the top of the Fed's list, but it's a longstanding market mover when it comes to bonds and, thus, rates. Today's installment was much weaker than expected. Weak data correlates with lower rates, all other things being equal.
Bonds improved immediately after the release. This allowed mortgage lenders to set lower rates today. Some lenders had already published their initial rates for the day and several of them ended up issuing positive reprices before the end of the day.
The bond market is closed tomorrow for the holiday, but will be back to digest an even more important economic report on Friday morning: the big jobs report. [30 year fixed 7.08%]
emphasis added
• All US markets will be closed in observance of Independence Day
Heavy Truck Sales Unchanged in June
by Calculated Risk on 7/03/2024 02:23:00 PM
This graph shows heavy truck sales since 1967 using data from the BEA. The dashed line is the June 2024 seasonally adjusted annual sales rate (SAAR).
Heavy truck sales really collapsed during the great recession, falling to a low of 180 thousand SAAR in May 2009. Then heavy truck sales increased to a new record high of 570 thousand SAAR in April 2019.
 Click on graph for larger image.
Note: "Heavy trucks - trucks more than 14,000 pounds gross vehicle weight."
Heavy truck sales declined sharply at the beginning of the pandemic, falling to a low of 308 thousand SAAR in May 2020.
Heavy truck sales were at 496 thousand SAAR in June, up slightly from 495 thousand in May, and down 9.6% from 549 thousand SAAR in June 2023.
Usually, heavy truck sales decline sharply prior to a recession. Heavy truck sales are solid.
FOMC Minutes: "Additional favorable data were required to give them greater confidence that inflation" was Moving to Target
by Calculated Risk on 7/03/2024 02:00:00 PM
From the Fed: Minutes of the Federal Open Market Committee June 11–12, 2024. Excerpt:
With regard to the outlook for inflation, participants emphasized that they were strongly committed to their 2 percent objective and that they remained concerned that elevated inflation continued to harm the purchasing power of households, especially those least able to meet the higher costs of essentials like food, housing, and transportation. Participants highlighted a variety of factors that were likely to help contribute to continued disinflation in the period ahead. The factors included continued easing of demand–supply pressures in product and labor markets, lagged effects on wages and prices of past monetary policy tightening, the delayed response of measured shelter prices to rental market developments, or the prospect of additional supply-side improvements. The latter prospect included the possibility of a boost to productivity associated with businesses' deployment of artificial intelligence–related technology. Participants observed that longer-term inflation expectations had remained well anchored and viewed this anchoring as underpinning the disinflation process. Participants affirmed that additional favorable data were required to give them greater confidence that inflation was moving sustainably toward 2 percent.
...
In discussing the outlook for monetary policy, participants noted that progress in reducing inflation had been slower this year than they had expected last December. They emphasized that they did not expect that it would be appropriate to lower the target range for the federal funds rate until additional information had emerged to give them greater confidence that inflation was moving sustainably toward the Committee's 2 percent objective. In discussing their individual outlooks for the target range for the federal funds rate, participants emphasized the importance of conditioning future policy decisions on incoming data, the evolving economic outlook, and the balance of risks. Several participants noted that financial market reactions to data and feedback received from contacts suggested that the Committee's policy approach was generally well understood. Some participants suggested that further clarity about the FOMC's reaction function might be provided by communications that emphasized the Committee's data-dependent approach, with monetary policy decisions being conditional on the evolution of the economy rather than being on a preset path. A couple of participants remarked that providing more information about the Committee's views on the economic outlook and the risks around the outlook would improve the public's understanding of the Committee's decisions.
emphasis added
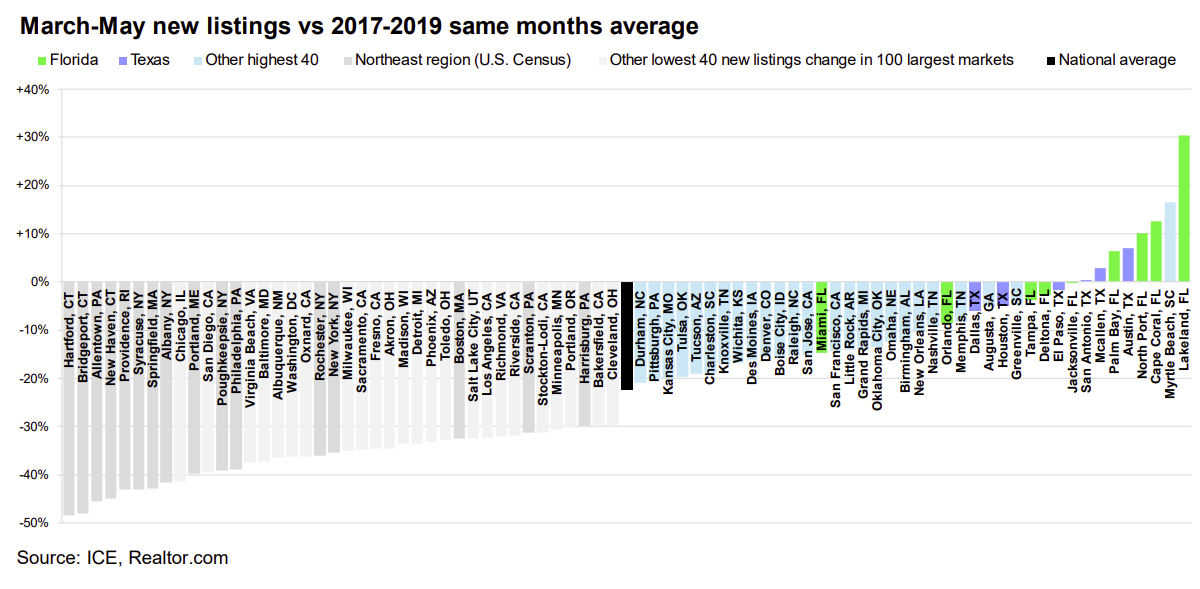
ICE Mortgage Monitor: Existing Home Inventory Surges in Florida and Texas
by Calculated Risk on 7/03/2024 11:50:00 AM
Today, in the Real Estate Newsletter: ICE Mortgage Monitor: Existing Home Inventory Surges in Florida and Texas
Brief excerpt:
The local data I track is indicating that Florida and Texas inventory is above normal, whereas inventory is still low in most of the country.There is much more in the article.
• While the new inflow of listings nationally has averaged a 23% deficit from pre-pandemic levels over the past three months, most Texas and Florida markets are seeing new listing volumes near or above pre-pandemic averages
• In fact, of the 19 markets with new listings volumes within 10% of their 2017-2019 same-month average, 14 are in Texas or Florida, including seven of the nine markets with surpluses
ISM® Services Index Decreases to 48.8% in June
by Calculated Risk on 7/03/2024 10:00:00 AM
(Posted with permission). The ISM® Services index was at 48.8%, down from 53.8% last month. The employment index decreased to 46.1%, from 47.1%. Note: Above 50 indicates expansion, below 50 in contraction.
From the Institute for Supply Management: Services PMI® at 48.8% June 2024 Services ISM® Report On Business®
Economic activity in the services sector contracted in June for the second time in the last three months, say the nation's purchasing and supply executives in the latest Services ISM® Report On Business®. The Services PMI® registered 48.8 percent, indicating sector contraction for the third time in 49 months.The PMI was below expectations.
The report was issued today by Steve Miller, CPSM, CSCP, Chair of the Institute for Supply Management® (ISM®) Services Business Survey Committee: “In June, the Services PMI® registered 48.8 percent, 5 percentage points lower than May’s figure of 53.8 percent. The reading in June was a reversal compared to May and the second in contraction territory in the last three months. Before April, the services sector grew for 15 straight months following a composite index reading of 49 percent in December 2022; the last contraction before that was in May 2020 (45.4 percent). The Business Activity Index registered 49.6 percent in June, which is 11.6 percentage points lower than the 61.2 percent recorded in May and the first month of contraction since May 2020. The New Orders Index contracted in June for the first time since December 2022; the figure of 47.3 percent is 6.8 percentage points lower than the May reading of 54.1 percent. The Employment Index contracted for the sixth time in seven months and at a faster rate in June; the reading of 46.1 percent is a 1-percentage point decrease compared to the 47.1 percent recorded in May.
emphasis added
Trade Deficit Increased to $75.1 Billion in May
by Calculated Risk on 7/03/2024 08:48:00 AM
The Census Bureau and the Bureau of Economic Analysis reported:
The U.S. Census Bureau and the U.S. Bureau of Economic Analysis announced today that the goods and services deficit was $75.1 billion in May, up $0.6 billion from $74.5 billion in April, revised.
May exports were $261.7 billion, $1.8 billion less than April exports. May imports were $336.7 billion, $1.2 billion less than April imports.
emphasis added
 Click on graph for larger image.
Both exports and imports decreased in May.
Exports are up 4.3% year-over-year; imports are up 6.2% year-over-year.
Both imports and exports decreased sharply due to COVID-19 and then bounced back - imports and exports have generally increased recently.
The second graph shows the U.S. trade deficit, with and without petroleum.
 The blue line is the total deficit, and the black line is the petroleum deficit, and the red line is the trade deficit ex-petroleum products.
Note that net, exports of petroleum products are positive and have been increasing.
The trade deficit with China decreased to $24.0 billion from $25.2 billion a year ago.
Weekly Initial Unemployment Claims Increase to 238,000
by Calculated Risk on 7/03/2024 08:30:00 AM
The DOL reported:
n the week ending June 29, the advance figure for seasonally adjusted initial claims was 238,000, an increase of 4,000 from the previous week's revised level. The previous week's level was revised up by 1,000 from 233,000 to 234,000. The 4-week moving average was 238,500, an increase of 2,250 from the previous week's revised average. The previous week's average was revised up by 250 from 236,000 to 236,250.The following graph shows the 4-week moving average of weekly claims since 1971.
emphasis added
 Click on graph for larger image.
The dashed line on the graph is the current 4-week average. The four-week average of weekly unemployment claims increased to 238,500.
The previous week was revised up.
Weekly claims were higher than the consensus forecast.
ADP: Private Employment Increased 150,000 in June
by Calculated Risk on 7/03/2024 08:15:00 AM
Private sector employment increased by 150,000 jobs in June and annual pay was up 4.9 percent year-over-year, according to the June ADP® National Employment ReportTM produced by the ADP Research Institute® in collaboration with the Stanford Digital Economy Lab (“Stanford Lab”). ...This was below the consensus forecast of 170,000. The BLS report will be released Friday, and the consensus is for 180,000 non-farm payroll jobs added in June.
"Job growth has been solid, but not broad-based,” said Nela Richardson, chief economist, ADP. “Had it not been for a rebound in hiring in leisure and hospitality, June would have been a downbeat month.”
emphasis added
MBA: Mortgage Applications Decreased in Weekly Survey
by Calculated Risk on 7/03/2024 07:00:00 AM
From the MBA: Mortgage Applications Increase in Latest MBA Weekly Survey
Mortgage applications decreased 2.6 percent from one week earlier, according to data from the Mortgage Bankers Association’s (MBA) Weekly Applications Survey for the week ending June 28, 2024.
The Market Composite Index, a measure of mortgage loan application volume, decreased 2.6 percent on a seasonally adjusted basis from one week earlier. On an unadjusted basis, the Index increased 8 percent compared with the previous week. The Refinance Index decreased 2 percent from the previous week and was 29 percent higher than the same week one year ago. The seasonally adjusted Purchase Index decreased 3 percent from one week earlier. The unadjusted Purchase Index increased 7 percent compared with the previous week and was 12 percent lower than the same week one year ago.
“Mortgage rates moved higher last week, crossing the 7 percent mark, even as the latest inflation data has kept market expectations alive for a rate cut from the Fed later this year,” said Mike Fratantoni, MBA’s SVP and Chief Economist. “Purchase applications decreased the final full week of June, even as both new and existing inventories have increased over the past few months. Refinance activity also remains subdued – although there was a slight increase in applications for conventional refinance loans.”
...
The average contract interest rate for 30-year fixed-rate mortgages with conforming loan balances ($766,550 or less) increased to 7.03 percent from 6.93 percent, with points increasing to 0.62 from 0.61 (including the origination fee) for 80 percent loan-to-value ratio (LTV) loans.
emphasis added
 Click on graph for larger image.
The first graph shows the MBA mortgage purchase index.
According to the MBA, purchase activity is down 12% year-over-year unadjusted.
Red is a four-week average (blue is weekly).
Purchase application activity is up slightly from the lows in late October 2023, but still below the lowest levels during the housing bust.

The second graph shows the refinance index since 1990.
With higher mortgage rates, the refinance index declined sharply in 2022, and mostly flat lined since then with a slight increase recently.
Tuesday, July 02, 2024
Wednesday: Trade Deficit, Unemployment Claims, ADP Employment, FOMC Minutes
by Calculated Risk on 7/02/2024 07:53:00 PM
 Note: Mortgage rates are from MortgageNewsDaily.com and are for top tier scenarios.
Wednesday:
• At 7:00 AM ET, The Mortgage Bankers Association (MBA) will release the results for the mortgage purchase applications index.
• At 8:15 AM, The ADP Employment Report for June. This report is for private payrolls only (no government). The consensus is for 170,000 payroll jobs added in June, up from 152,000 in May.
• At 8:30 AM, The initial weekly unemployment claims report will be released. The consensus is for 228 thousand initial claims, down from 233 thousand last week.
• Also at 8:30 AM, Trade Balance report for May from the Census Bureau. The consensus is the trade deficit to be $72.2 billion. The U.S. trade deficit was at $74.6 billion the previous month.
• At 10:00 AM, the ISM Services Index for June. The consensus is for a reading of 52.5, down from 53.8.
• At 2:00 PM, FOMC Minutes, Meeting of June 11-12, 2024
US markets will close at 1:00 PM ET prior to the Independence Day Holiday.


