 RSS Feed
 by Calculated Risk on 5/31/2023 04:54:00 PM
Wednesday, May 31, 2023
Las Vegas April 2023: Visitor Traffic Down 4% Compared to 2019; Convention Traffic Down 30%
Note: I like using Las Vegas as a measure of recovery for both leisure (visitors) and business (conventions).
From the Las Vegas Visitor Authority: April 2023 Las Vegas Visitor Statistics
Las Vegas hosted approximately 3,385,500 visitors in Apr 2023, on par with the robust volumes achieved last Apr when pent‐up demand overtook receding pandemic impacts.
Overall hotel occupancy reached 84.3% for the month, similar to last Apr (+0.3 pts YoY). As Weekend occupancy (92.4%) saw a ‐0.8 pts YoY decline, Midweek occupancy approached 81%, surpassing last Apr by 1.5 pts.
Overall ADR reached $171, down 3.3% from Apr 2022 while RevPAR exceeded $144, ‐3.0% YoY.
 Click on graph for larger image.
 The first graph shows visitor traffic for 2019 (Black), 2020 (light blue), 2021 (purple), 2022 (orange), and 2023 (red).
Visitor traffic was down 4.4% compared to the same month in 2019.
Visitor traffic was up 0.1% compared to last April.
The second graph shows convention traffic.
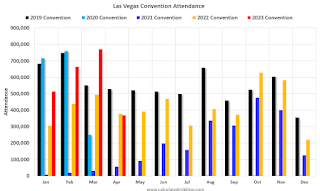
Convention traffic was down 30.2% compared to April 2019, and down 2.1% compared to April 2022.The second graph shows convention traffic.

Note: There was almost no convention traffic from April 2020 through May 2021.
Fed's Beige Book: "Economic activity was little changed ... Residential real estate activity picked up"
by Calculated Risk on 5/31/2023 02:06:00 PM
Fed's Beige Book "This report was prepared at the Federal Reserve Bank of Chicago based on information collected on or before May 22, 2023."
Economic activity was little changed overall in April and early May. Four Districts reported small increases in activity, six no change, and two slight to moderate declines. Expectations for future growth deteriorated a little, though contacts still largely expected a further expansion in activity. Consumer expenditures were steady or higher in most Districts, with many noting growth in spending on leisure and hospitality. Education and healthcare organizations saw steady activity on balance. Manufacturing activity was flat to up in most Districts, and supply chain issues continued to improve. Demand for transportation services was down, especially in trucking, where contacts reported there was a "freight recession." Residential real estate activity picked up in most Districts despite continued low inventories of homes for sale. Commercial construction and real estate activity decreased overall, with the office segment continuing to be a weak spot. Outlooks for farm income fell in most districts, and energy activity was flat to down amidst lower natural gas prices. Financial conditions were stable or somewhat tighter in most Districts. Contacts in several Districts noted a rise in consumer loan delinquencies, which were returning closer to pre-pandemic levels. High inflation and the end of Covid-19 benefits continued to stress the budgets of low- and moderate-income households, driving increased demand for social services, including food and housing.
Employment increased in most Districts, though at a slower pace than in previous reports. Overall, the labor market continued to be strong, with contacts reporting difficulty finding workers across a wide range of skill levels and industries. That said, contacts across Districts also noted that the labor market had cooled some, highlighting easier hiring in construction, transportation, and finance. Many contacts said they were fully staffed, and some reported they were pausing hiring or reducing headcounts due to weaker actual or prospective demand or to greater uncertainty about the economic outlook. Staffing firms reported slower growth in demand. As in the last report, wages grew modestly.
emphasis added
BLS: Job Openings Increased to 10.1 million in April
by Calculated Risk on 5/31/2023 10:05:00 AM
From the BLS: Job Openings and Labor Turnover Summary
The number of job openings edged up to 10.1 million on the last business day of April, the U.S. Bureau of Labor Statistics reported today. Over the month, the number of hires changed little at 6.1 million. Total separations decreased to 5.7 million. Within separations, quits (3.8 million) changed little, while layoffs and discharges (1.6 million) decreased.The following graph shows job openings (black line), hires (dark blue), Layoff, Discharges and other (red column), and Quits (light blue column) from the JOLTS.
emphasis added
This series started in December 2000.
Note: The difference between JOLTS hires and separations is similar to the CES (payroll survey) net jobs headline numbers. This report is for April the employment report this Friday will be for May.
 Click on graph for larger image.
Note that hires (dark blue) and total separations (red and light blue columns stacked) are usually pretty close each month. This is a measure of labor market turnover. When the blue line is above the two stacked columns, the economy is adding net jobs - when it is below the columns, the economy is losing jobs.
The spike in layoffs and discharges in March 2020 is labeled, but off the chart to better show the usual data.
Jobs openings increased in April to 10.1 million from 9.7 million in March.
The number of job openings (black) were down 14% year-over-year.
Quits were down 16% year-over-year. These are voluntary separations. (See light blue columns at bottom of graph for trend for "quits").
Lawler: Census Finally Releases 2020 Census Demographic Profile and Demographic and Housing Characteristics File
by Calculated Risk on 5/31/2023 08:32:00 AM
Today, in the Calculated Risk Real Estate Newsletter: Lawler: Census Finally Releases 2020 Census Demographic Profile and Demographic and Housing Characteristics File
Excerpt:
From housing economist Tom Lawler:
After an unusually long delay related to the challenges associated with conducting a Census during a nationwide pandemic, last week Census finally released the 2020 Census Demographic Profile and Demographic and Housing Characteristics File. ... The table below focuses on housing/household related data.
In a report later this week I will discuss some of the issues associated with the Census population numbers with respect to age distribution and discuss how that impacts folks trying to project the population by age.

There is much more in the article. You can subscribe at https://calculatedrisk.substack.com/
MBA: Mortgage Applications Decreased in Weekly Survey
by Calculated Risk on 5/31/2023 07:00:00 AM
From the MBA: Mortgage Applications Decrease in Latest MBA Weekly Survey
Mortgage applications decreased 3.7 percent from one week earlier, according to data from the Mortgage Bankers Association’s (MBA) Weekly Mortgage Applications Survey for the week ending May 26, 2023.
The Market Composite Index, a measure of mortgage loan application volume, decreased 3.7 percent on a seasonally adjusted basis from one week earlier. On an unadjusted basis, the Index decreased 5 percent compared with the previous week. The Refinance Index decreased 7 percent from the previous week and was 45 percent lower than the same week one year ago. The seasonally adjusted Purchase Index decreased 3 percent from one week earlier. The unadjusted Purchase Index decreased 4 percent compared with the previous week and was 31 percent lower than the same week one year ago.
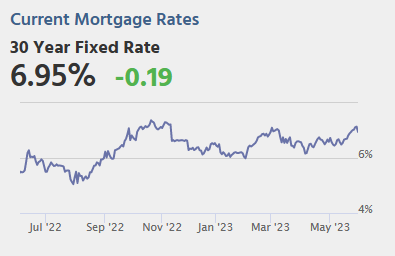
“Inflation is still running too high, and recent economic data is beginning to convince investors that the Federal Reserve will not be cutting rates anytime soon. Mortgage rates for conforming balance 30-year loans were being quoted above 7 percent by some lenders last week, and the weekly average at 6.9 percent reached the highest level since last November,” said Mike Fratantoni, MBA’s SVP and Chief Economist. “Application volumes for both purchase and refinance loans decreased last week due to these higher rates. While refinance demand is almost entirely driven by the level of rates, purchase volume continues to be constrained by the lack of homes on the market.”
...
The average contract interest rate for 30-year fixed-rate mortgages with conforming loan balances ($726,200 or less) increased to 6.91 percent from 6.69 percent, with points increasing to 0.83 from 0.66 (including the origination fee) for 80 percent loan-to-value ratio (LTV) loans. The effective rate increased from last week.
emphasis added
 Click on graph for larger image.
The first graph shows the MBA mortgage purchase index.
According to the MBA, purchase activity is down 31% year-over-year unadjusted.
Red is a four-week average (blue is weekly). This is close to the lowest level since the mid 1990s.

The second graph shows the refinance index since 1990.
With higher mortgage rates, the refinance index declined sharply in 2022 - and has mostly flat lined at a low level since then.
Tuesday, May 30, 2023
Wednesday: Job Openings, Chicago PMI, Fed's Beige Book
by Calculated Risk on 5/30/2023 08:47:00 PM
 From Matthew Graham at Mortgage News Daily: Rates Drop Sharply to Start The New Week
The past 2 weeks were fairly rough for fans of low mortgage rates. The average lender moved higher at the fastest pace since February over that time. By the end of last week, the average lender was back above 7% for a top tier 30yr fixed scenario (and "well above" on Friday).Wednesday:
What a difference a weekend makes. While we're nowhere near the lower levels seen several weeks ago, the bond market (which underlies rates) was able to recover all of the losses seen on Thursday and Friday as well as a small portion of Wednesday's to boot. [30 year fixed 6.96%]
emphasis added
• At 7:00 AM ET, The Mortgage Bankers Association (MBA) will release the results for the mortgage purchase applications index.
• At 9:45 AM, Chicago Purchasing Managers Index for May.
• At 10:00 AM, Job Openings and Labor Turnover Survey for April from the BLS.
• At 2:00 PM, the Federal Reserve Beige Book, an informal review by the Federal Reserve Banks of current economic conditions in their Districts.
A few comments on the Seasonal Pattern for House Prices
by Calculated Risk on 5/30/2023 02:41:00 PM
Two key points:
1) There is a clear seasonal pattern for house prices.
2) The surge in distressed sales during the housing bust distorted the seasonal pattern.
For in depth description of these issues, see Jed Kolko's article from 2014 "Let’s Improve, Not Ignore, Seasonal Adjustment of Housing Data"
Note: I was one of several people to question the change in the seasonal factor (here is a post in 2009) - and this led to S&P Case-Shiller questioning the seasonal factor too (from April 2010). I still use the seasonal factor (I think it is better than using the NSA data).
 Click on graph for larger image.
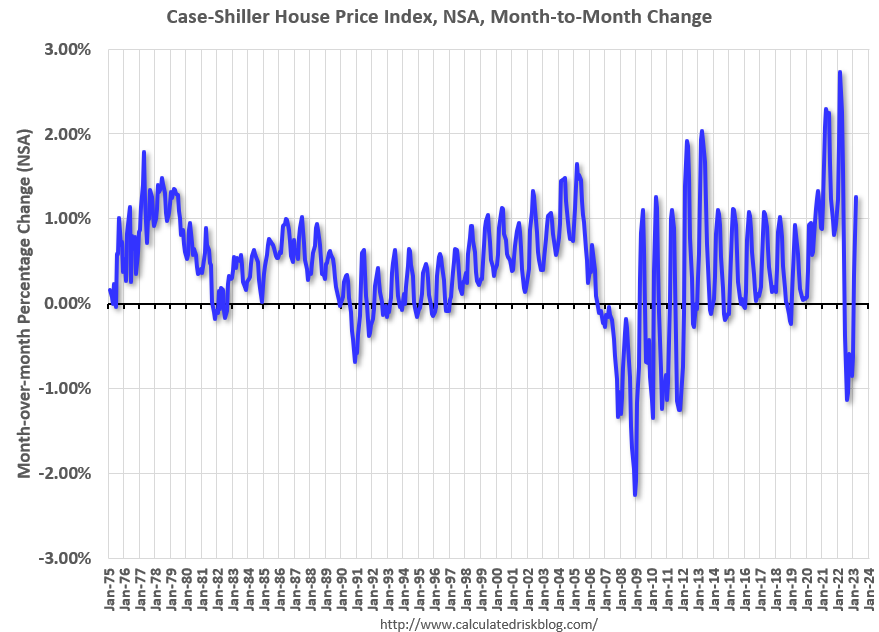
This graph shows the month-to-month change in the NSA Case-Shiller National index since 1987 (through March 2023). The seasonal pattern was smaller back in the '90s and early '00s and increased once the bubble burst.
The seasonal swings declined following the bust, however the price surge changed the month-over-month pattern.
 The second graph shows the seasonal factors for the Case-Shiller National index since 1987. The factors started to change near the peak of the bubble, and really increased during the bust since normal sales followed the regular seasonal pattern - and distressed sales happened all year.
The swings in the seasonal factors have decreased, and the seasonal factors had been moving back towards more normal levels.
Note that the recent price surge - and slowdown - has only increased the swing in seasonal factors a little. Unless there is a wave of distressed sales (unlikely due to mostly solid lending), the seasonal pattern won't be distorted like during the housing bust.
Comments on March Case-Shiller and FHFA House Prices
by Calculated Risk on 5/30/2023 10:30:00 AM
Today, in the Calculated Risk Real Estate Newsletter: Case-Shiller: National House Price Index Increased 0.7% year-over-year in March
Excerpt:
The recent increase in mortgage rates to over 7% will not impact the Case-Shiller index until reports released in the Fall.
...
Here is a comparison of year-over-year change in median house prices from the NAR and the year-over-year change in the Case-Shiller index. Median prices are distorted by the mix and repeat sales indexes like Case-Shiller and FHFA are probably better for measuring prices. However, in general, the Case-Shiller index follows the median price.
The median price was down 1.7% year-over-year in April, and the Case-Shiller National Index will likely be down year-over-year in the April report.
Note: I’ll have more on real prices, price-to-rent and affordability later this week.

There is much more in the article. You can subscribe at https://calculatedrisk.substack.com/
Case-Shiller: National House Price Index increased 0.7% year-over-year in March
by Calculated Risk on 5/30/2023 09:30:00 AM
S&P/Case-Shiller released the monthly Home Price Indices for March ("March" is a 3-month average of January, February and March closing prices).
This release includes prices for 20 individual cities, two composite indices (for 10 cities and 20 cities) and the monthly National index.
From CNBC Home price declines may be over, S&P Case-Shiller says
Nationally, home prices in March were 0.7% higher than March 2022, the S&P CoreLogic Case-Shiller Indices said Tuesday.
“The modest increases in home prices we saw a month ago accelerated in March 2023,” said Craig J. Lazzara, managing director at S&P DJI in a release. “Two months of increasing prices do not a definitive recovery make, but March’s results suggest that the decline in home prices that began in June 2022 may have come to an end.”
The 10-city composite, which includes the Los Angeles and New York metropolitian areas, dropped 0.8% year over year, compared with a 0.5% increase in the previous month. The 20-city composite, which includes Dallas-Fort Worth and the Detroit area, fell 1.1%, down from a 0.4% annual gain in the previous month.
emphasis added
 Click on graph for larger image.
 The first graph shows the nominal seasonally adjusted Composite 10, Composite 20 and National indices (the Composite 20 was started in January 2000).
The Composite 10 index is up 0.6% in March (SA) and down 3.6% from the recent peak in June 2022.
The Composite 20 index is up 0.5% (SA) in March and down 4.0% from the recent peak in June 2022.
The National index is up 0.4% (SA) in March and is down 2.2% from the peak in June 2022.
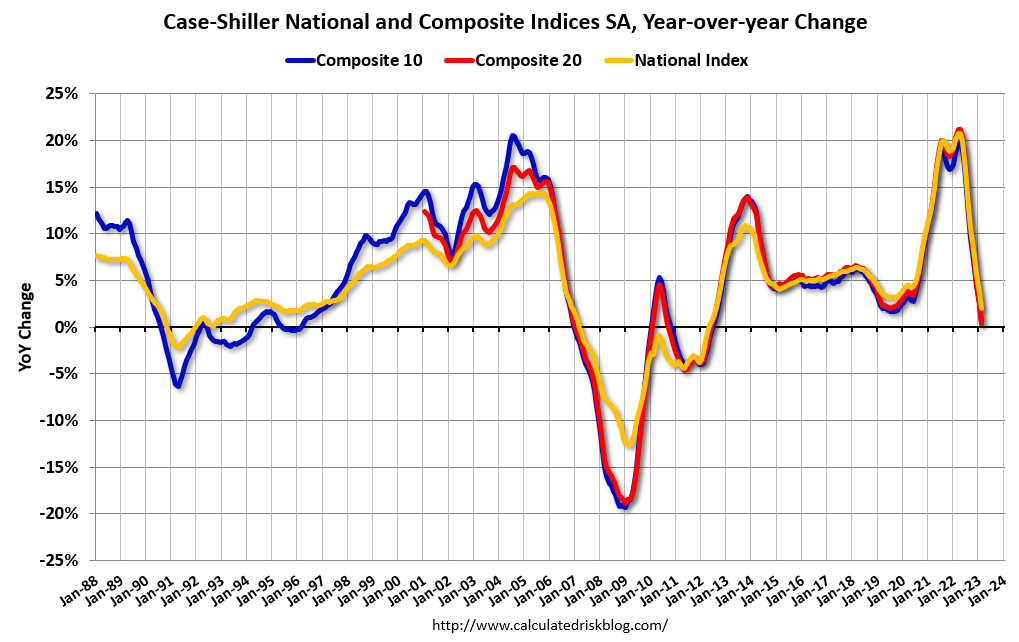
 The second graph shows the year-over-year change in all three indices.
The Composite 10 SA is down 0.8% year-over-year. The Composite 20 SA is down 1.1% year-over-year.
The National index SA is up 0.7% year-over-year.
Annual price increases were below expectations. I'll have more later.
Monday, May 29, 2023
Tuesday: Case-Shiller House Prices
by Calculated Risk on 5/29/2023 08:13:00 PM
 Hanging out with my 101 years young data at a Memorial Day Ceremony in San Diego.
Weekend:
• Schedule for Week of May 28, 2023
Monday:
• At 9:00 AM ET, S&P/Case-Shiller House Price Index for March.
• Also at 9:00 AM, FHFA House Price Index for March 2022. This was originally a GSE only repeat sales, however there is also an expanded index.
• At 10:00 AM, Dallas Fed Survey of Manufacturing Activity for May.
From CNBC: Pre-Market Data and Bloomberg futures S&P 500 are up 9 and DOW futures are up 42 (fair value).
 Oil prices were up over the last week with WTI futures at $72.51 per barrel and Brent at $76.57 per barrel. A year ago, WTI was at $115, and Brent was at $123 - so WTI oil prices are down about 37% year-over-year.
Here is a graph from Gasbuddy.com for nationwide gasoline prices. Nationally prices are at $3.54 per gallon. A year ago, prices were at $4.60 per gallon, so gasoline prices are down $1.06 per gallon year-over-year.
Recession Watch Update
by Calculated Risk on 5/29/2023 12:06:00 PM
Way back in 2013, I wrote a post "Predicting the Next Recession. In that 2013 post, I wrote:
The next recession will probably be caused by one of the following (from least likely to most likely):Unfortunately, in 2020, one of those low probability events happened (pandemic), and that led to a recession in 2020.
3) An exogenous event such as a pandemic, significant military conflict, disruption of energy supplies for any reason, a major natural disaster (meteor strike, super volcano, etc), and a number of other low probability reasons. All of these events are possible, but they are unpredictable, and the probabilities are low that they will happen in the next few years or even decades.
emphasis added
2) Significant policy error. Two examples: not reaching a fiscal agreement and going off the "fiscal cliff" probably would have led to a recession, and Congress refusing to "pay the bills" would have been a policy error that would have taken the economy into recession.That was written in 2013, and it appears once again that we've avoided the "default" policy error.
1) Most of the post-WWII recessions were caused by the Fed tightening monetary policy to slow inflation. I think this is the most likely cause of the next recession. Usually, when inflation starts to become a concern, the Fed tries to engineer a "soft landing", and frequently the result is a recession.And this most common cause of a recession is the current concern.
Talk of a recession increased last year. For example, from ECRI a year ago (May 26, 2022): Opinion: It’s time to prepare for a recession (ht SV). However, I wasn't even on recession watch!
A key mistake some analysts are making is ignoring distortions caused by the pandemic. See Pandemic Economics, Housing and Monetary Policy: Part I and Part II.
In December 2022 I went on "recession watch" for only the 3rd time in the 19 years that I've been writing this blog, but I noted I didn't see a recession coming yet. The other two times were in early 2007 (housing bust / financial crisis), and in March 2020 (pandemic).
The economic forecast prepared by the staff for the May FOMC meeting continued to assume that the effects of the expected further tightening in bank credit conditions, amid already tight financial conditions, would lead to a mild recession starting later this year, followed by a moderately paced recovery. Real GDP was projected to decelerate over the next two quarters before declining modestly in both the fourth quarter of this year and the first quarter of next year.And the FOMC members have been essentially projecting a recession for some time (although they avoid using the word "recession"). Here are their March projections for GDP and unemployment.
emphasis added
| GDP projections of Federal Reserve Governors and Reserve Bank presidents, Change in Real GDP1 | ||||
|---|---|---|---|---|
| Projection Date | 2023 | 2024 | 2025 | |
| Mar 2023 | 0.0 to 0.8 | 1.0 to 1.5 | 1.7 to 2.1 | |
Since Q1 real GDP growth was at 1.3% on a seasonally adjusted annual rate (SAAR) basis, and Q2 GDP is tracking 1% to 2%, the FOMC is essentially projecting GDP will decline over the last 2 quarters of 2023.
And on unemployment:
2 Projections for the unemployment rate are for the average civilian unemployment rate in the fourth quarter of the year indicated.
Since the unemployment rate was at 3.4% in April and depending on the growth of the civilian labor force in 2023, the FOMC is projecting between 800 thousand and 2 million jobs lost over the last two quarters of 2023. That is a clear employment recession.
| Unemployment projections of Federal Reserve Governors and Reserve Bank presidents, Unemployment Rate2 | ||||
|---|---|---|---|---|
| Projection Date | 2023 | 2024 | 2025 | |
| Mar 2023 | 4.0 to 4.7 | 4.3 to 4.9 | 4.3 to 4.8 | |
Since the unemployment rate was at 3.4% in April and depending on the growth of the civilian labor force in 2023, the FOMC is projecting between 800 thousand and 2 million jobs lost over the last two quarters of 2023. That is a clear employment recession.
Two key leading economic indicators are suggesting a recession this year.
 One of the leading indicators for recessions is the yield curve. Here is a graph of 10-Year Treasury Constant Maturity Minus 2-Year Treasury Constant Maturity from FRED.
Click here for interactive graph at FRED.
When the yield curve turns negative - the 2-year yields more than the 10-year - that suggests investors think interest rates will decline, usually indicating a coming recession. However, economist Campbell Harvey (yield curve inventor) noted last year:
My yield-curve indicator has gone Code Red. It is 8 for 8 in forecasting recessions since 1968 —with no false alarms. I have reasons to believe, however, that it is flashing a false signal.
...
The yield curve has now inverted for a ninth time since 1968. Does it spell doom? I am not so sure.
One of my favorite models for business cycle forecasting uses new home sales (also housing starts and residential investment). The purpose of the next graph is to show that these three indicators generally reach peaks and troughs together. Note that Residential Investment is quarterly and single-family starts and new home sales are monthly.
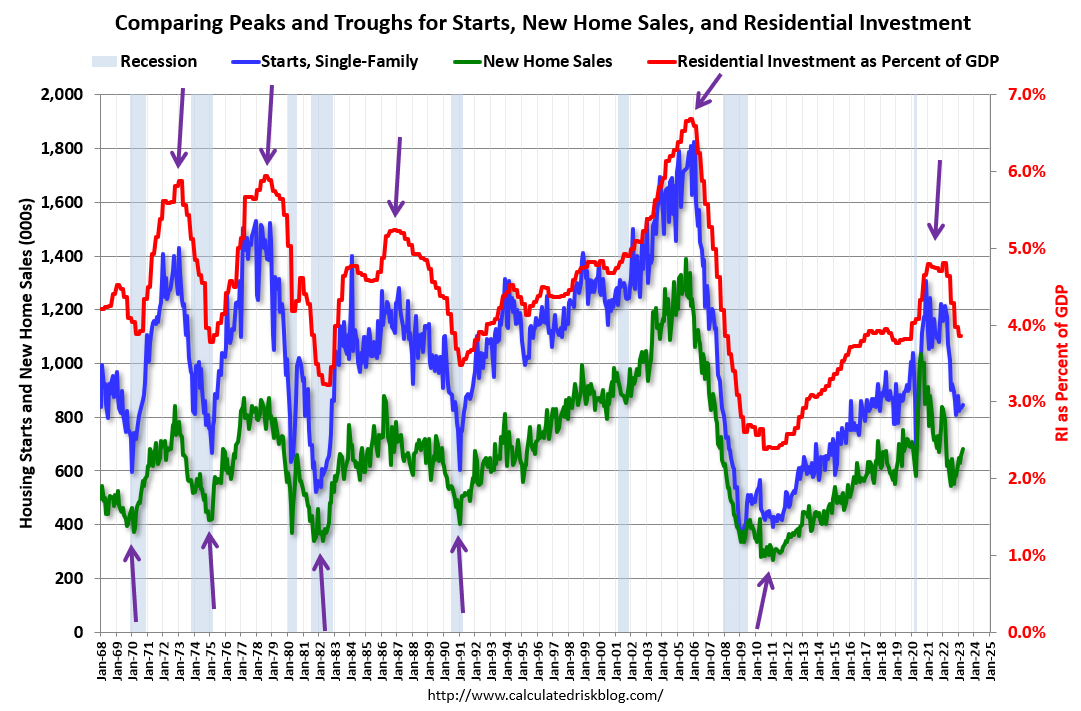 The arrows point to some of the earlier peaks and troughs for these three measures - and the most recent peak.
New home sales peaked in 2020 as pandemic buying soared. Then new home sales and single-family starts turned down in 2021, but that was partly due to the huge surge in sales during the pandemic. In 2022, both new home sales and single-family starts turned down in response to higher mortgage rates. Residential investment has also peaked.
This decline in residential investment would usually suggest a recession is coming.
 This third graph shows the YoY change in New Home Sales from the Census Bureau. Currently new home sales (based on 3-month average) are up 4% year-over-year!
Usually when the YoY change in New Home Sales falls about 20%, a recession will follow. An exception for this data series was the mid '60s when the Vietnam buildup kept the economy out of recession. Another exception was in late 2021 - we saw a significant YoY decline in new home sales related to the pandemic and the surge in new home sales in the second half of 2020. I ignored that downturn as a pandemic distortion (I am not a slave to any model). Also note that the sharp decline in 2010 was related to the housing tax credit policy in 2009 - and was just a continuation of the housing bust.
The YoY change in new home sales in late 2022 and early 2023 would usually suggest a possible recession. However, another feature of new home sales is that it usually leads the economy out of recession (an exception was following the housing bust, but I was able to correctly anticipate the recovery anyway).
Because of the low level of existing home inventory, new home sales are starting to pick up, and that suggests a possible recovery!

Another indicator I like to use is heavy truck sales. This graph shows heavy truck sales since 1967 using data from the BEA. The dashed line is the April 2023 seasonally adjusted annual sales rate (SAAR). Note: "Heavy trucks - trucks more than 14,000 pounds gross vehicle weight."
Heavy truck sales were at 563 thousand SAAR in April, up from 486 thousand in March, and up 23% from 456 thousand SAAR in April 2022.
Usually, heavy truck sales decline sharply prior to a recession, however sales were strong in April.
 A short term leading indicator I'll be watching is the 4-week average of unemployment claims.
This has increased recently and if this increases further, we might be entering an employment recession.
The FOMC is in a tough situation. The primary transmission mechanisms for Fed policy are usually housing followed by vehicle sales (a distant second). This time vehicle sales were more suppressed by supply chain issues (a pandemic distortion) and have increased recently, and it appears new home sales might have bottomed!
Fed policy is currently restrictive, and keeping policy at this level will likely bring inflation back to the target of 2%. Further rate increases would likely be a policy error and increase the odds of a recession. The current target range for the federal funds rate is 5 to 5-1/4 percent, well above r* + target inflation. Note: r* is an estimate of the real rate of interest.
My sense is growth will stay sluggish in 2023, but the economy will avoid recession. Monetary policy is restrictive, the fiscal policy will be a slight drag if the recent agreement passes the House and Senate. Vehicle sales will probably increase this year, but new home sales will stay low - but increase year-over-year for the remainder of 2023.
There is downside risk if the FOMC overtightens, or Congress forces a debt default (although this seems less likely now). Since two of the best leading indicators are suggesting a recession, I'll stay on recession watch, and I might change my view on a recession in a few months.
Housing May 29th Weekly Update: Inventory Increased 2.1% Week-over-week
by Calculated Risk on 5/29/2023 09:15:00 AM
Altos reports that active single-family inventory was up 2.1% week-over-week.
 Click on graph for larger image.
This inventory graph is courtesy of Altos Research.
As of May 26th, inventory was at 433 thousand (7-day average), compared to 424 thousand the prior week.
Year-to-date, inventory is down 11.8%. And inventory is up 6.8% from the seasonal bottom six weeks ago.
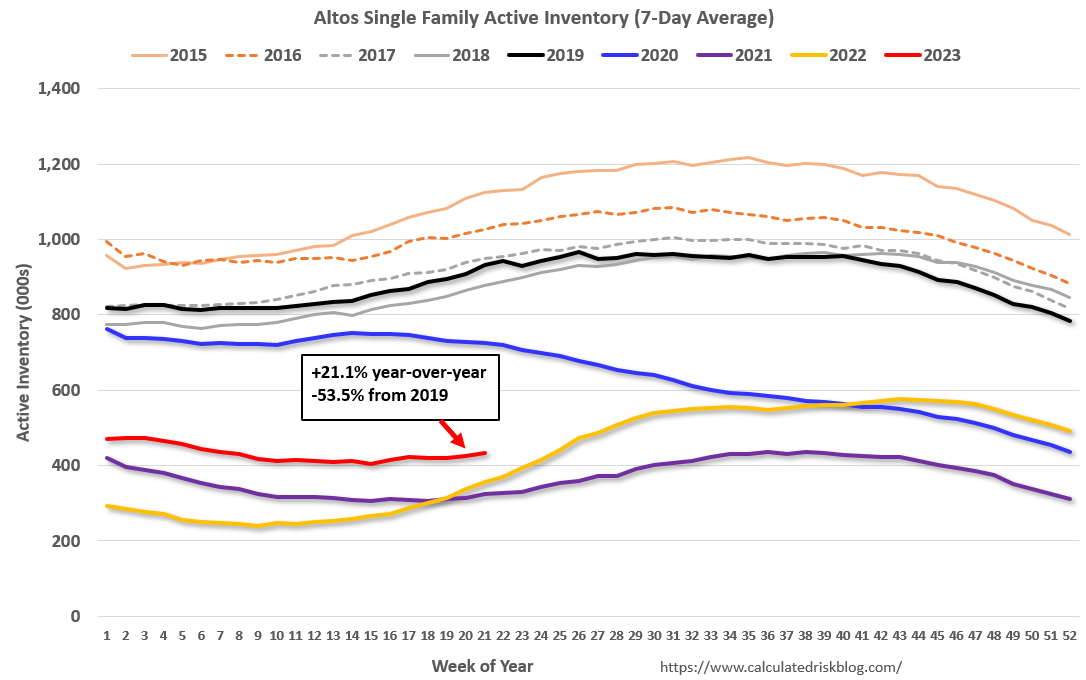
The red line is for 2023. The black line is for 2019. Note that inventory is up from the previous two years (the record low was in 2022), but still well below normal levels.
Inventory was up 21.1% compared to the same week in 2022 (last week it was up 25.4%), and down 53.5% compared to the same week in 2019 (last week down 53.3%).
It appears likely inventory will be down year-over-year in late June.
Mike Simonsen discusses this data regularly on Youtube.
Sunday, May 28, 2023
Hotels: Occupancy Rate Down 1.5% Year-over-year
by Calculated Risk on 5/28/2023 10:32:00 AM
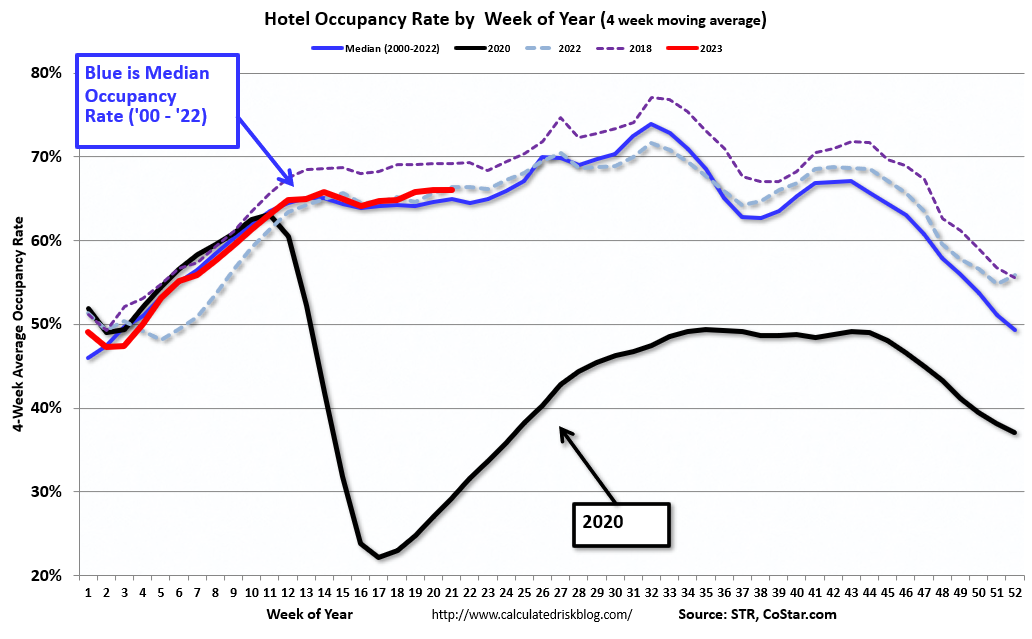
U.S. hotel performance increased from the previous week and showed improved comparisons year over year, according to STR‘s latest data through 20 May.The following graph shows the seasonal pattern for the hotel occupancy rate using the four-week average.
14-20 May 2023 (percentage change from comparable week in 2022):
• Occupancy: 67.5% (-1.5%)
• Average daily rate (ADR): US$158.53 (+3.6%)
• Revenue per available room (RevPAR): US$106.98 (+2.1%)
emphasis added
 Click on graph for larger image.
The red line is for 2023, black is 2020, blue is the median, and dashed light blue is for 2022. Dashed purple is for 2018, the record year for hotel occupancy.
The 4-week average of the occupancy rate is slightly above the median rate for the period 2000 through 2022 (Blue).
Note: Y-axis doesn't start at zero to better show the seasonal change.
The 4-week average of the occupancy rate will move mostly sideways for the next several weeks until the summer travel season.
Saturday, May 27, 2023
Real Estate Newsletter Articles this Week: "Multi-Family Delinquencies Increased"
by Calculated Risk on 5/27/2023 02:11:00 PM
At the Calculated Risk Real Estate Newsletter this week:
• New Home Sales at 683,000 Annual Rate in April
• Two Key Housing Themes: Low Inventory and Few Distressed Sales
• Total Housing Completions will Likely Decrease Slightly in 2023; The Mix will Change
• Fannie and Freddie Serious Delinquencies in April: Single Family Declined, Multi-Family Increased
• Final Look at Local Housing Markets in April
This is usually published 4 to 6 times a week and provides more in-depth analysis of the housing market.
You can subscribe at https://calculatedrisk.substack.com/
Most content is available for free (and no Ads), but please subscribe!
Schedule for Week of May 28, 2023
by Calculated Risk on 5/27/2023 08:11:00 AM
The key report scheduled for this week is the May employment report.
Other key reports include the March Case-Shiller house prices, May ISM Manufacturing and May Vehicle Sales.
All US markets will be closed in observance of Memorial Day.
 9:00 AM: S&P/Case-Shiller House Price Index for March.
This graph shows the year-over-year change in the seasonally adjusted National Index, Composite 10 and Composite 20 indexes through the most recent report (the Composite 20 was started in January 2000).
9:00 AM: FHFA House Price Index for March 2022. This was originally a GSE only repeat sales, however there is also an expanded index.
10:00 AM: Dallas Fed Survey of Manufacturing Activity for May.
7:00 AM ET: The Mortgage Bankers Association (MBA) will release the results for the mortgage purchase applications index.
9:45 AM: Chicago Purchasing Managers Index for May.
 10:00 AM ET: Job Openings and Labor Turnover Survey for April from the BLS.
 This graph shows job openings (black line), hires (purple), Layoff, Discharges and other (red column), and Quits (light blue column) from the JOLTS.
Jobs openings decreased in March to 9.6 million from 10.0 million in February. The number of job openings (black) were down 20% year-over-year.
2:00 PM: the Federal Reserve Beige Book, an informal review by the Federal Reserve Banks of current economic conditions in their Districts.
8:15 AM: The ADP Employment Report for May. This report is for private payrolls only (no government). The consensus is for 160,000 payroll jobs added in May, down from 296,000 in April.
8:30 AM: The initial weekly unemployment claims report will be released. The consensus is for 234 thousand initial claims, up from 229 thousand last week.
 All day: Light vehicle sales for May. The consensus is for light vehicle sales to be 14.5 million SAAR in May, up from 14.3 million in April (Seasonally Adjusted Annual Rate).
This graph shows light vehicle sales since the BEA started keeping data in 1967. The dashed line is the sales rate for last month.
10:00 AM: ISM Manufacturing Index for May. The consensus is for the ISM to be at 47.0, down from 47.1 in April.
10:00 AM: Construction Spending for April. The consensus is for a 0.2% increase in construction spending.
----- Friday, June 2nd -----
 8:30 AM: Employment Report for May. The consensus is for 180,000 jobs added, and for the unemployment rate to increase to 3.5%.
There were 253,000 jobs added in April, and the unemployment rate was at 3.4%.
This graph shows the jobs added per month since January 2021.
10:00 AM: ISM Manufacturing Index for May. The consensus is for the ISM to be at 47.0, down from 47.1 in April.
10:00 AM: Construction Spending for April. The consensus is for a 0.2% increase in construction spending.
 8:30 AM: Employment Report for May. The consensus is for 180,000 jobs added, and for the unemployment rate to increase to 3.5%.
There were 253,000 jobs added in April, and the unemployment rate was at 3.4%.
This graph shows the jobs added per month since January 2021.
Friday, May 26, 2023
May 26th COVID Update: New Pandemic Lows for Deaths and Hospitalizations
by Calculated Risk on 5/26/2023 09:01:00 PM
 Note: Mortgage rates are from MortgageNewsDaily.com and are for top tier scenarios.
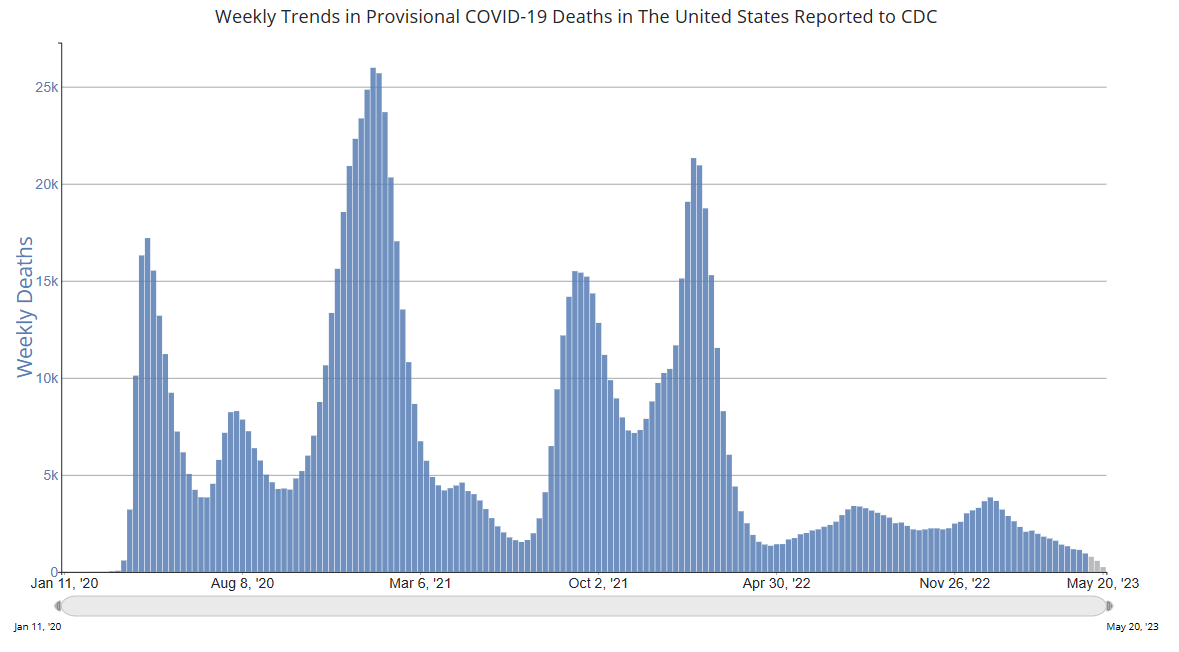
Due to changes at the CDC, weekly cases are no longer updated.
After the first few weeks, the pandemic low for weekly deaths had been the week of July 7, 2021, at 1,690 deaths (until recently).
For COVID hospitalizations, the previous low was 9,821 (until four weeks ago).
| COVID Metrics | ||||
|---|---|---|---|---|
| Now | Week Ago | Goal | ||
| Hospitalized2 | 7,465 | 8,249 | ≤3,0001 | |
| Deaths per Week2 | 778 | 949 | ≤3501 | |
| 1my goals to stop weekly posts, 2Weekly for Currently Hospitalized, and Deaths 🚩 Increasing number weekly for Hospitalized and Deaths ✅ Goal met. | ||||
 Click on graph for larger image.
This graph shows the weekly (columns) number of deaths reported.
For deaths, I'm currently using 3 weeks ago for "now", since the most recent two weeks will be revised significantly.
Fannie and Freddie Serious Delinquencies in April: Single Family Declined, Multi-Family Increased
by Calculated Risk on 5/26/2023 01:08:00 PM
Today, in the Calculated Risk Real Estate Newsletter: Fannie and Freddie Serious Delinquencies in April: Single Family Declined, Multi-Family Increased
Brief excerpt:
Single-family serious delinquencies continued to decline in April, however, multi-family serious delinquencies are now increasing.You can subscribe at https://calculatedrisk.substack.com/.
...
Freddie Mac reports that multi-family delinquencies increased to 0.19% in April, up from 0.08% in April 2022..
This graph shows the Freddie multi-family serious delinquency rate since 2012. Rates were still high in 2012 following the housing bust and financial crisis.
The multi-family rate increased following the pandemic and has increased recently as rent growth has slowed, vacancy rates have increased, and interest rates have increased sharply. This will be something to watch as rents soften.

Q2 GDP Tracking: Around 1% to 2%
by Calculated Risk on 5/26/2023 11:58:00 AM
From BofA:
Overall, today's higher than expected personal income and outlays and durable goods print along with the wider than expected advance goods trade deficit decreased our 2Q US GDP tracking from 1.1% q/q saar to 0.9% q/q saar. [May 26th estimate]From Goldman:
emphasis added
Personal income increased as expected and personal spending increased by more than expected in April. ... Both headline and core durable goods orders increased against consensus expectations for declines. The goods trade deficit widened significantly more than expected in April, driven by a large decline in exports and a more modest rise in imports. We boosted our Q2 GDP tracking estimate by one tenth to +2.1% (qoq ar). [May 26th estimate]And from the Altanta Fed: GDPNow
The GDPNow model estimate for real GDP growth (seasonally adjusted annual rate) in the second quarter of 2023 is 1.9 percent on May 26, down from 2.9 percent on May 17. After recent releases from the US Census Bureau, the US Bureau of Economic Analysis, and the National Association of Realtors, decreases in the nowcasts of second-quarter real net exports and second-quarter real gross private domestic investment growth were partially offset by increases in the nowcasts of second-quarter real personal consumption expenditures growth and second-quarter real government spending growth. [May 26th estimate]
PCE Measure of Shelter Still Accelerating YoY
by Calculated Risk on 5/26/2023 08:58:00 AM
Here is a graph of the year-over-year change in shelter from the CPI report and housing from the PCE report this morning, both through April 2023.
 CPI Shelter was up 8.1% year-over-year in April, down from 8.2% in March.
Housing (PCE) was up 8.4% YoY in April, up from 8.3% in March.
Since asking rents are soft and Year-over-year Rent Growth Continues to Decelerate this means both CPI and PCE measures are currently overstating actual inflation.
Since asking rents are soft and Year-over-year Rent Growth Continues to Decelerate this means both CPI and PCE measures are currently overstating actual inflation.
Personal Income increased 0.4% in April; Spending increased 0.8%
by Calculated Risk on 5/26/2023 08:40:00 AM
The BEA released the Personal Income and Outlays report for April:
Personal income increased $80.1 billion (0.4 percent at a monthly rate) in April, according to estimates released today by the Bureau of Economic Analysis. Disposable personal income (DPI) increased $79.4 billion (0.4 percent) and personal consumption expenditures (PCE) increased $151.7 billion (0.8 percent).The April PCE price index increased 4.4 percent year-over-year (YoY), up from 4.2 percent YoY in March, and down from the recent peak of 7.0 percent in June 2022.
The PCE price index increased 0.4 percent. Excluding food and energy, the PCE price index increased 0.4 percent. Real DPI increased less than 0.1 percent in April and Real PCE increased 0.5 percent; goods increased 0.8 percent and services increased 0.3 percent.
emphasis added
The PCE price index, excluding food and energy, increased 4.7 percent YoY, up from 4.6 percent in March, and down from the recent peak of 5.4 percent in February 2022.
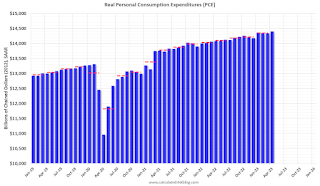
The following graph shows real Personal Consumption Expenditures (PCE) through April 2023 (2012 dollars). Note that the y-axis doesn't start at zero to better show the change.
 Click on graph for larger image.
The dashed red lines are the quarterly levels for real PCE.
Personal income was at expectations, and PCE was above expectations.
Inflation was above expectations.


