 RSS Feed
 by Calculated Risk on 11/10/2021 02:01:00 PM
Wednesday, November 10, 2021
Housing: Inventory will Tell the Tale
Today, in the Real Estate Newsletter: Inventory will Tell the Tale
Excerpt:
We are being flooded with housing stories. Will house prices decline or will price growth just slow? Does the US have a housing shortage? If mortgage rates rise to 4%, will that “halt the housing market” as Ivy Zelman said on CNBC?You can subscribe at https://calculatedrisk.substack.com/ (Currently all content is available for free, but please subscribe).
Although my crystal ball is cloudy at this point, I believe inventory will tell the tale. That is why I watch inventory closely. Not just the monthly existing home sales report from the National Association of Realtors (NAR) and the monthly new home sales report from the Census Bureau. I also use weekly data from Altos Research (See Altos’ Mike Simonsen’s weekly presentation on YouTube).
And I track inventory and sales for 30+ local markets each month.
...
My Spidey senses are tingling, however it isn't obvious why this time - or what the outcome will be.
But I believe one thing is certain: inventory will tell the tale!
Cleveland Fed: Median CPI increased 0.6% and Trimmed-mean CPI increased 0.7% in October
by Calculated Risk on 11/10/2021 11:56:00 AM
The Cleveland Fed released the median CPI and the trimmed-mean CPI this morning:
According to the Federal Reserve Bank of Cleveland, the median Consumer Price Index rose 0.6% in October. The 16% trimmed-mean Consumer Price Index increased 0.7% in October. "The median CPI and 16% trimmed-mean CPI are measures of core inflation calculated by the Federal Reserve Bank of Cleveland based on data released in the Bureau of Labor Statistics’ (BLS) monthly CPI report".
Note: The Cleveland Fed released the median CPI details for September here. "Fuel oil and other fuels" were up 193% annualized.
Note that Owners' Equivalent Rent and Rent of Primary Residence account for almost 1/3 of median CPI, and these measures were up over 5% annualized in October.
 Click on graph for larger image.
This graph shows the year-over-year change for these four key measures of inflation.
 Click on graph for larger image.
This graph shows the year-over-year change for these four key measures of inflation.
On a year-over-year basis, the median CPI rose 3.1%, the trimmed-mean CPI rose 4.1%, and the CPI less food and energy rose 4.6%. Core PCE is for September and increased 3.6% year-over-year.
MBA: "Mortgage Delinquencies Decrease in the Third Quarter of 2021"
by Calculated Risk on 11/10/2021 10:11:00 AM
From the MBA: Mortgage Delinquencies Decrease in the Third Quarter of 2021
The delinquency rate for mortgage loans on one-to-four-unit residential properties decreased to a seasonally adjusted rate of 4.88 percent of all loans outstanding at the end of the third quarter of 2021, according to the Mortgage Bankers Association’s (MBA) National Delinquency Survey.
For the purposes of the survey, MBA asks servicers to report loans in forbearance as delinquent if the payment was not made based on the original terms of the mortgage. The delinquency rate was down 59 basis points from the second quarter of 2021 and down 277 basis points from one year ago.
“For the fifth consecutive quarter, the mortgage delinquency rate declined, commensurate with a decline in the U.S. unemployment rate over the same time period,” said Marina Walsh, CMB, MBA’s Vice President of Industry Analysis. “The improvement was driven entirely by a decline in later-stage delinquent loans – those loans that are 90 days or past due, but not in foreclosure. By the end of the third quarter, many borrowers were approaching the 18-month expiration point of their forbearance terms and were being placed in permanent home retention solutions, such as modifications and loan deferrals.”
Walsh added, “Once these borrowers entered permanent post-forbearance workouts and resumed payments, they moved from delinquent to current status.”
emphasis added
 Click on graph for larger image.
This graph shows the percent of loans delinquent by days past due. Overall delinquencies decreased in Q3.
From the MBA:
Compared to last quarter, the seasonally adjusted mortgage delinquency rate decreased for all loans outstanding. By stage, the 30-day delinquency rate increased 10 basis points to 1.51 percent, the 60-day delinquency rate remained unchanged at 0.52 percent, and the 90-day delinquency bucket decreased 68 basis points to 2.85 percent.This sharp increase last year in the 90-day bucket was due to loans in forbearance (included as delinquent, but not reported to the credit bureaus).
...
The delinquency rate includes loans that are at least one payment past due but does not include loans in the process of foreclosure. The percentage of loans in the foreclosure process at the end of the third quarter was 0.46 percent, down 5 basis points from the second quarter of 2021 and 13 basis points lower than one year ago. This is the lowest foreclosure inventory rate since the fourth quarter of 1981. The percentage of loans on which foreclosure actions were started in the third quarter fell by 1 basis point to 0.03 percent, which is the lowest starts rate reported in the survey and consistent with the last three quarters of 2020.
The percent of loans in the foreclosure process declined further, and was at the lowest level since 1981.
Weekly Initial Unemployment Claims Decrease to 267,000
by Calculated Risk on 11/10/2021 08:37:00 AM
The DOL reported:
In the week ending November 6, the advance figure for seasonally adjusted initial claims was 267,000, a decrease of 4,000 from the previous week's revised level. This is the lowest level for initial claims since March 14, 2020 when it was 256,000. The previous week's level was revised up by 2,000 from 269,000 to 271,000. The 4-week moving average was 278,000, a decrease of 7,250 from the previous week's revised average. This is the lowest level for this average since March 14, 2020 when it was 225,500. The previous week's average was revised up by 500 from 284,750 to 285,250.The following graph shows the 4-week moving average of weekly claims since 1971.
emphasis added
 Click on graph for larger image.
The dashed line on the graph is the current 4-week average. The four-week average of weekly unemployment claims decreased to 278,000.
The previous week was revised up.
Regular state continued claims increased to 2,160,000 (SA) from 2,101,000 (SA) the previous week.
Weekly claims were above consensus forecast.
BLS: CPI increased 0.9% in October, Core CPI increased 0.6%
by Calculated Risk on 11/10/2021 08:32:00 AM
The Consumer Price Index for All Urban Consumers (CPI-U) increased 0.9 percent in October on a seasonally adjusted basis after rising 0.4 percent in September, the U.S. Bureau of Labor Statistics reported today. Over the last 12 months, the all items index increased 6.2 percent before seasonal adjustment.Both CPI and core CPI were well above expectations. I'll post a graph later today after the Cleveland Fed releases the median and trimmed-mean CPI.
The monthly all items seasonally adjusted increase was broad-based, with increases in the indexes for energy, shelter, food, used cars and trucks, and new vehicles among the larger contributors. The energy index rose 4.8 percent over the month, as the gasoline index increased 6.1 percent and the other major energy component indexes also rose. The food index increased 0.9 percent as the index for food at home rose 1.0 percent.
The index for all items less food and energy rose 0.6 percent in October after increasing 0.2 percent in September. Most component indexes increased over the month. Along with shelter, used cars and trucks, and new vehicles, the indexes for medical care, for household furnishing and operations, and for recreation all increased in October. The indexes for airline fares and for alcoholic beverages were among the few to decline over the month.
The all items index rose 6.2 percent for the 12 months ending October, the large st 12-month increase since the period ending November 1990. The index for all items less food and energy rose 4.6 percent over the last 12 months, the largest 12-month increase since the period ending August 1991. The energy index rose 30.0 percent over the last 12 months, and the food index increased 5.3 percent.
emphasis added
MBA: Mortgage Applications Increase in Latest Weekly Survey
by Calculated Risk on 11/10/2021 07:00:00 AM
From the MBA: Mortgage Applications Increase in Latest MBA Weekly Survey
Mortgage applications increased 5.5 percent from one week earlier, according to data from the Mortgage Bankers Association’s (MBA) Weekly Mortgage Applications Survey for the week ending November 5, 2021.
... The Refinance Index increased 7 percent from the previous week and was 28 percent lower than the same week one year ago. The seasonally adjusted Purchase Index increased 3 percent from one week earlier. The unadjusted Purchase Index increased 0.1 percent compared with the previous week and was 4 percent lower than the same week one year ago.
“Mortgage rates moved lower for the second week in a row for all loan types. The 30-year fixed rate decreased to 3.16 percent and has declined 14 basis points over the past two weeks. Although overall activity remains close to January 2020 lows, homeowners acted on the decrease in rates. Refinance activity was up 7 percent overall, with gains in both conventional and government refinances. Additionally, the average loan balance for a refinance application was the highest in a month,” said Joel Kan, MBA’s Associate Vice President of Economic and Industry Forecasting. “Purchase applications were also strong last week, increasing just under 3 percent and down only 4 percent from last year’s pace. The dip in rates might have helped to bring some buyers back into the market, but housing inventory is still extremely low and price growth remains elevated.”
...
The average contract interest rate for 30-year fixed-rate mortgages with conforming loan balances ($548,250 or less) decreased to 3.16 percent from 3.24 percent, with points remaining unchanged at 0.34 (including the origination fee) for 80 percent loan-to-value ratio (LTV) loans.
emphasis added
 Click on graph for larger image.
The first graph shows the refinance index since 1990.
With relatively low rates, the index remains somewhat elevated, and the recent decline in rates has given the index a slight boost.
The second graph shows the MBA mortgage purchase index
 According to the MBA, purchase activity is down 4% year-over-year unadjusted.
This is the smallest year-over-year decline in some time (purchase activity was strong in the 2nd half of 2020). However, this week last year was weak - so it is likely the year-over-year decline will be larger in coming weeks.
Note: Red is a four-week average (blue is weekly).
Tuesday, November 09, 2021
Wednesday: CPI, Unemployment Claims
by Calculated Risk on 11/09/2021 08:01:00 PM
Wednesday:
• At 7:00 AM ET, The Mortgage Bankers Association (MBA) will release the results for the mortgage purchase applications index.
• At 8:30 AM, The Consumer Price Index for October from the BLS. The consensus is for a 0.6% increase in CPI, and a 0.4% increase in core CPI.
• At 8:30 AM, The initial weekly unemployment claims report will be released. The consensus is for 260 thousand initial claims, down from 269 thousand last week.
November 9th COVID-19: 16 Days till Thanksgiving and New Cases Stuck at 70,000+ per Day
by Calculated Risk on 11/09/2021 04:24:00 PM
The CDC is the source for all data.
According to the CDC, on Vaccinations. Total doses administered: 433,156,393, as of a week ago 423,005,384, or 1.45 million doses per day.
| COVID Metrics | ||||
|---|---|---|---|---|
| Today | Week Ago | Goal | ||
| Percent fully Vaccinated | 58.5% | 58.0% | ≥70.0%1 | |
| Fully Vaccinated (millions) | 194.2 | 192.6 | ≥2321 | |
| New Cases per Day3 | 73,312 | 75,209 | ≤5,0002 | |
| Hospitalized3 | 39,841 | 43,056 | ≤3,0002 | |
| Deaths per Day3 | 1,078 | 1,211 | ≤502 | |
| 1 Minimum to achieve "herd immunity" (estimated between 70% and 85%). 2my goals to stop daily posts, 37 day average for Cases, Currently Hospitalized, and Deaths 🚩 Increasing 7 day average week-over-week for Cases, Hospitalized, and Deaths ✅ Goal met. | ||||
IMPORTANT: For "herd immunity" most experts believe we need 70% to 85% of the total population fully vaccinated (or already had COVID). Note: COVID will probably stay endemic (at least for some time).
KUDOS to the residents of the 5 states that have achieved 70% of total population fully vaccinated: Vermont at 71.8%, Rhode Island, Connecticut, Maine, and Massachusetts at 70.1% .
KUDOS also to the residents of the 16 states and D.C. that have achieved 60% of total population fully vaccinated: New York at 67.3%, , New Jersey, Maryland, New Mexico, New Hampshire, Washington, Oregon, Virginia, District of Columbia, Colorado, California, Pennsylvania, Illinois, Delaware, Minnesota, Florida, and Hawaii at 60.1%.
The following 20 states have between 50% and 59.9% fully vaccinated: Wisconsin at 58.7%, Nebraska, Iowa, Illinois, Michigan, Kentucky, South Dakota, Texas, Arizona, Kansas, Nevada, Alaska, Utah, North Carolina, Ohio, Montana, Oklahoma, South Carolina, Indiana, and Missouri at 50.1%.
Next up (total population, fully vaccinated according to CDC) are Georgia at 48.8%, Arkansas at 48.4%, Tennessee at 48.1% and Louisiana at 48.0%.
 Click on graph for larger image.
This graph shows the daily (columns) and 7 day average (line) of positive tests reported.
2nd Look at Local Housing Markets in October: Memphis, Nashville, New Hampshire, North Texas (Dallas) and San Diego.
by Calculated Risk on 11/09/2021 01:31:00 PM
Today, in the Real Estate Newsletter: 2nd Look at Local Housing Markets in October
Excerpt:
Here is a summary of active listings for the housing markets that have reported so far in October. For these markets, inventory was down 9.6% in October MoM from September, and down 30.4% YoY.You can subscribe at https://calculatedrisk.substack.com/ (Currently all content is available for free, but please subscribe).
Inventory in San Diego is at an all time low!
Inventory almost always declines seasonally in October, so the MoM decline is not a surprise. Last month, these eight markets were down 27.4% YoY, so the YoY decline in October is larger than in September. This is not indicating a slowing market (but this is just 8 early reporting markets).

NY Fed Q3 Report: Total Household Debt Climbs to Over $15 trillion
by Calculated Risk on 11/09/2021 11:17:00 AM
From the NY Fed: Total Household Debt Climbs to Over $15 trillion in Q3 2021, Driven by New Extensions of Credit
The Federal Reserve Bank of New York's Center for Microeconomic Data today issued its Quarterly Report on Household Debt and Credit. The Report shows that total household debt increased by $286 billion (1.9%) to $15.24 trillion in the third quarter of 2021. The total debt balance is now $1.1 trillion higher than at the end of 2019. It is also $890 billion higher than in Q3 2020, and $2.57 trillion higher, in nominal terms, than the $12.68 trillion peak seen in 2008. The Report is based on data from the New York Fed's Consumer Credit Panel, a nationally representative random sample of individual- and household-level debt and credit records drawn from anonymized Equifax credit data.
Mortgage balances—the largest component of household debt—rose by $230 billion and stood at $10.67 trillion at the end of September. Credit card balances increased by $17 billion, the same size increase as in the second quarter. Despite the increase, credit card balances remain $123 billion lower than they had been at the end of 2019. Auto loan balances increased by $28 billion in the third quarter. Student loan balances grew by $14 billion, coinciding with the academic borrowing year. In total, non-housing balances grew by $61 billion, with gains across all debt types.
emphasis added
 Click on graph for larger image.
Here are three graphs from the report:
The first graph shows aggregate consumer debt increased in Q3. Household debt previously peaked in 2008, and bottomed in Q3 2013. Unlike following the great recession, there wasn't a huge decline in debt during the pandemic.
From the NY Fed:
Aggregate household debt balances increased by $286 billion in the third quarter of 2021, a 1.9% rise from 2021Q2, and now stand at $15.24 trillion. Balances are $1.1 trillion higher than at the end of 2019 and $890 billion higher than in 2020Q3, and $2.57 trillion higher, in nominal terms, than the $12.68 trillion peak seen in 2008.
 The second graph shows the percent of debt in delinquency.
The overall delinquency rate decreased in Q3. From the NY Fed:
Aggregate delinquency rates have remained low and declining since the beginning of the pandemic, reflecting an uptake in forbearances (provided by both the CARES Act and voluntarily offered by lenders), which protect borrowers’ credit records from the reporting of skipped or deferred payments. As of late September, 2.7% of outstanding debt was in some stage of delinquency, a 2.0 percentage point decrease from the fourth quarter of 2019, just before the COVID-19 pandemic hit the United States. Of the $412 billion of debt that is delinquent, $302 billion is seriously delinquent (at least 90 days late or “severely derogatory”, which includes some debts that have been removed from lenders’ books but upon which they continue to attempt collection).
 The third graph shows Mortgage Originations by Credit Score.
From the NY Fed:
The credit scores of newly originated mortgages had increased in the early part of the pandemic, and although they edged down slightly, they still remain very high and reflect a continuing high quality of newly opened mortgages as well as a higher share of refinances. ... There was $1.11 trillion in newly originated mortgage debt in 2021Q3, with 69% of it originated to borrowers with credit scores over 760. 2% of newly originated mortgages were originated to subprime borrowers, a sharp contrast to the 12% average seen between 2003-2007.There is much more in the report.
Second Home Market: South Lake Tahoe in October
by Calculated Risk on 11/09/2021 08:37:00 AM
With the pandemic, there was a surge in 2nd home buying. In response, Fannie made some lending changes, from Jann Swanson at MortgageNewsDaily: Fannie Warns Lenders on Investment Properties and 2nd Homes.
I'm looking at data for some second home markets - and I'm tracking those markets to see if there is an impact from the lending changes.
This graph is for South Lake Tahoe since 2004 through October 2021, and shows inventory (blue), and the year-over-year (YoY) change in the median price (12 month average).
Note: The median price is distorted by the mix, but this is the available data.
 Click on graph for larger image.
Following the housing bubble, prices declined for several years in South Lake Tahoe, with the median price falling about 50% from the bubble peak.
Currently inventory is still very low - above the record low set early in 2021, but down YoY - and prices are up sharply YoY.
This will be interesting to watch, but so far there isn't any evidence of a 2nd home slowdown in these numbers (The fires don't seem to have impacted these numbers either).
Monday, November 08, 2021
Tuesday: PPI, Quarterly Report on Household Debt and Credit
by Calculated Risk on 11/08/2021 09:01:00 PM
From Matthew Graham at Mortgage News Daily: Mortgage Rates Slightly Lower Despite Bond Market Weakness
Mortgage rates are directly based on trading levels in the bond market, so it's almost a given that rates will move in the same direction as bond yields on any given day. But for a variety of reasons, it doesn't happen like that every day. Today was just such a day.Tuesday:
...
Keep in mind that we're talking about extremely small movement. Between Friday and today, you'd likely see the exact same "note rate" for any given conventional 30yr fixed scenario. The improvements would only be detectable in the form of upfront costs. [30 year fixed 3.07%]
emphasis added
• At 6:00 AM ET, NFIB Small Business Optimism Index for October.
• At 8:30 AM, The Producer Price Index for October from the BLS. The consensus is for a 0.6% increase in PPI, and a 0.5% increase in core PPI.
• At 11:00 AM, NY Fed: Q3 Quarterly Report on Household Debt and Credit
November 8th COVID-19: New Cases Stuck at 70,000+ per Day
by Calculated Risk on 11/08/2021 06:00:00 PM
The CDC is the source for all data.
According to the CDC, on Vaccinations. Total doses administered: 430,927,624, as of a week ago 422,070,099, or 1.27 million doses per day.
| COVID Metrics | ||||
|---|---|---|---|---|
| Today | Week Ago | Goal | ||
| Percent fully Vaccinated | 58.4% | 58.0% | ≥70.0%1 | |
| Fully Vaccinated (millions) | 193.8 | 192.5 | ≥2321 | |
| New Cases per Day3🚩 | 71,867 | 71,470 | ≤5,0002 | |
| Hospitalized3 | 38,570 | 43,574 | ≤3,0002 | |
| Deaths per Day3 | 1,068 | 1,176 | ≤502 | |
| 1 Minimum to achieve "herd immunity" (estimated between 70% and 85%). 2my goals to stop daily posts, 37 day average for Cases, Currently Hospitalized, and Deaths 🚩 Increasing 7 day average week-over-week for Cases, Hospitalized, and Deaths ✅ Goal met. | ||||
IMPORTANT: For "herd immunity" most experts believe we need 70% to 85% of the total population fully vaccinated (or already had COVID). Note: COVID will probably stay endemic (at least for some time).
KUDOS to the residents of the 5 states that have achieved 70% of total population fully vaccinated: Vermont at 71.7%, Rhode Island, Connecticut, Maine, and Massachusetts at 70.0% .
KUDOS also to the residents of the 16 states and D.C. that have achieved 60% of total population fully vaccinated: New York at 67.2%, , New Jersey, Maryland, New Mexico, New Hampshire, Washington, Oregon, Virginia, District of Columbia, Colorado, California, Pennsylvania, Illinois, Delaware, Minnesota, Hawaii, and Florida at 60.1%.
The following 20 states have between 50% and 59.9% fully vaccinated: Wisconsin at 58.7%, Nebraska, Iowa, Illinois, Michigan, Kentucky, South Dakota, Texas, Arizona, Kansas, Nevada, Alaska, Utah, North Carolina, Ohio, Montana, Oklahoma, South Carolina, Indiana, and Missouri at 50.1%.
Next up (total population, fully vaccinated according to CDC) are Georgia at 48.6%, Arkansas at 48.4%, Louisiana at 48.0%, and Tennessee at 48.0%.
 Click on graph for larger image.
This graph shows the daily (columns) and 7 day average (line) of positive tests reported.
MBA Survey: "Share of Mortgage Loans in Forbearance Decreases to 2.06%"
by Calculated Risk on 11/08/2021 04:00:00 PM
Note: This is as of October 31st.
From the MBA: Share of Mortgage Loans in Forbearance Decreases to 2.06%
The Mortgage Bankers Association’s (MBA) latest Forbearance and Call Volume Survey revealed that the total number of loans now in forbearance decreased by 9 basis points from 2.15% of servicers’ portfolio volume in the prior week to 2.06% as of October 31, 2021. According to MBA’s estimate, 1 million homeowners are in forbearance plans.
The share of Fannie Mae and Freddie Mac loans in forbearance decreased 5 basis points to 0.92%. Ginnie Mae loans in forbearance decreased 13 basis points to 2.52%, and the forbearance share for portfolio loans and private-label securities (PLS) declined 13 basis points to 5.00%. The percentage of loans in forbearance for independent mortgage bank (IMB) servicers decreased 15 basis points relative to the prior week to 2.28%, and the percentage of loans in forbearance for depository servicers decreased 5 basis points to 2.02%.
“One million homeowners remained in forbearance as we reached the end of October, but the forbearance share continued to decline, with larger declines for portfolio and PLS loans,” said Mike Fratantoni, MBA’s Senior Vice President and Chief Economist. “More borrowers who exited forbearance the last week of October went into modifications, a sign that they have not yet regained their pre-pandemic level of income.”
Added Fratantoni, “The strong job market report from October, with another drop in the unemployment rate and a pickup in wage growth, is a positive sign for homeowners still struggling to get back on their feet.”
emphasis added
 Click on graph for larger image.
This graph shows the percent of portfolio in forbearance by investor type over time. The number of forbearance plans is decreasing rapidly recently since many homeowners have reached the end of the 18-month term.
Homebuilder Comments in October: “Builders are lifting sales caps"
by Calculated Risk on 11/08/2021 02:43:00 PM
Today, in the Real Estate Newsletter: Homebuilder Comments in October: “Builders are lifting sales caps"
Excerpt (much more in newsletter):
Some homebuilder comments courtesy of Rick Palacios Jr., Director of Research at John Burns Real Estate Consulting (a must follow for housing on twitter!):You can subscribe at https://calculatedrisk.substack.com/ (Currently all content is available for free, but please subscribe).
...
#Dallas builder: “Due to a large number of sales in 2021, we’ll have declines in 2022. This is due to land availability. Huge number of communities coming online in 2023. Supply chain issues are getting worse & have spread to land development.”.
#Seattle builder: “Sales & closings in 2022 will be negatively impacted by limited supply of lots being delivered to the market in early 2022 with recovery in late 2022. No demand impacts are forecasted to impact sales or closings in 2022.”
#Atlanta builder: “We pulled so many extra sales & starts into 2021 that we're going to be severely short on vacant developed lots in the first half of 2022, hence the huge projected slowdowns in sales & starts in 2022.”
Fed Survey: Banks reported Eased Standards, Weaker Demand for Residential Real Estate Loans
by Calculated Risk on 11/08/2021 02:24:00 PM
From the Federal Reserve: The October 2021 Senior Loan Officer Opinion Survey on Bank Lending Practices
The October 2021 Senior Loan Officer Opinion Survey on Bank Lending Practices addressed changes in the standards and terms on, and demand for, bank loans to businesses and households over the past three months, which generally correspond to the third quarter of 2021.
Regarding loans to businesses, respondents to the October survey, on balance, reported easier standards and stronger demand for commercial and industrial (C&I) loans to large and middle-market firms over the third quarter. Banks also reported easier standards for C&I loans to small firms, while demand from small firms remained basically unchanged.2 For commercial real estate (CRE), banks reported easier standards for all loan categories. Banks also reported stronger demand for multifamily loans and for loans secured by nonfarm nonresidential properties, while demand for construction and land development loans remained basically unchanged. For loans to households, banks eased standards across most categories of residential real estate (RRE) loans, on net, and reported weaker demand for most types of RRE loans over the third quarter. Banks also eased standards across all three consumer loan categories—credit card loans, auto loans, and other consumer loans—while reports on demand for consumer loans were mixed.
emphasis added
 Click on graph for larger image.
This graph on Residential Real Estate lending is from the Senior Loan Officer Survey Charts.
This shows that banks have eased standards (tightened for subprime), and that there is decreased demand for RRE loans.
Housing Inventory Nov 8th Update: Inventory Down 3.1% Week-over-week
by Calculated Risk on 11/08/2021 01:44:00 PM
Tracking existing home inventory will be very important this year.
 Click on graph for larger image in graph gallery.
This inventory graph is courtesy of Altos Research.
As of November 5th, inventory was at 401 thousand (7 day average), compared to 530 thousand for the same week a year ago. That is a decline of 24.3%.
Compared to the same week in 2019, inventory is down 55.3% from 898 thousand. A week ago, inventory was at 414 thousand, and was down 23.9% YoY.
Seasonally, inventory bottomed in April (usually inventory bottoms in January or February). Inventory was about 31% above the record low in early April.
Inventory peaked for the year in early September. Nine weeks ago inventory was at 437 thousand (the peak for the year), so inventory is currently off about 8.2% from the peak for the year.
Mike Simonsen discusses this data regularly on Youtube.
Altos Research has also seen a significant pickup in price decreases - now well above the level of a year ago - but still below a normal rate for October.
Fed Governor Bowman: The U.S. Housing and Mortgage Market: Risks and Resilience
by Calculated Risk on 11/08/2021 12:08:00 PM
From Fed Governor Michelle Bowman, At the Women in Housing and Finance Public Policy Luncheon, Washington, D.C., The U.S. Housing and Mortgage Market: Risks and Resilience. Bowman comments on house prices and the end of the forbearance programs. Here are here comments on house prices:
Home prices had been rising at a moderate rate since 2012, but since mid-2020, their growth has accelerated significantly. In total, home prices in September were 21 percent higher than in June 2020. Home price increases are also widespread. In September, about 90 percent of American cities had experienced rising home prices over the past three months, and the home price increases were substantial in most of these cities.
These sharp increases raise the concern that housing is overvalued and that home prices may decline. Historically, large home price increases are somewhat less concerning if they are supported by economic fundamentals rather than speculation. Fundamentals certainly seem to be a large part of the story behind the increases we've seen since the middle of last year. The demand for housing has risen for several reasons. Interest rates are low, families have accumulated savings, and income growth in the past 18 months has been quite strong. Families are also reconsidering where, and in what kind of home, they want to live. Purchases of second homes, for example, have been somewhat high in the past 18 months. Meanwhile, the supply of new homes has been held back by shortages of materials, labor, and developed lots.
Another reason to be less concerned about the recent escalation in home prices is that we do not see much of the decline in underwriting standards that fueled the home price bubble in the mid-2000s. Mortgage underwriting standards have remained conservative relative to the mid-2000s, in part because of the mortgage policy reforms that were put in place in the aftermath of the housing crisis. Investor activity is subdued relative to that time as well.
Nonetheless, home prices do decline from time to time. In inflation-adjusted terms, U.S. home prices fell from 1979 to 1982 and from 1989 to 1993, although by much less than from 2006 to 2012. Although the declines in national home prices were modest in some of these episodes, some areas of the country experienced sharp declines. As we all know, home price declines cause problems and strain throughout the economy. To give just one example, families and small business owners borrow against their homes to fund big-ticket purchases and business expansions, and house price declines make it harder to use homes as loan collateral. This effect can be amplified if a credit crunch occurs, in which lenders react to the decline in house prices by pulling back on their lending. With banks and the broader financial system currently quite robust, such a credit crunch seems unlikely. Nonetheless, I know how painful these declines can be, especially in certain markets. For example, from my experience living in rural Kansas, I understand how smaller communities with a less diversified housing and employment base can take a long time to recover from a fall in home prices. I wonder also about communities with a sizable share of second-home owners. So I will continue to watch the incoming data closely.
Falling home prices would certainly be very dramatic, but continued outsized increases could also be problematic. First, high home prices make it more difficult for low- to moderate-income households to become homeowners, as larger down payments and other financing requirements effectively lock these households out of the housing market. Second, and related to one of the Federal Reserve's monetary policy goals, rising home prices and rents raise the cost of housing. Because housing costs are a large share of living expenses for most people, these increases are adding to current inflationary pressures in the economy. Indeed, we are already seeing sizable increases in rent and owners' equivalent rent in many parts of the country.
emphasis added
Seven High Frequency Indicators for the Economy
by Calculated Risk on 11/08/2021 08:28:00 AM
These indicators are mostly for travel and entertainment. It will interesting to watch these sectors recover as the pandemic subsides.
The TSA is providing daily travel numbers.
This data is as of November 7th.
 Click on graph for larger image.
This data shows the 7-day average of daily total traveler throughput from the TSA for 2019 (Light Blue), 2020 (Blue) and 2021 (Red).
The dashed line is the percent of 2019 for the seven day average.
The 7-day average is down 20.2% from the same day in 2019 (79.8% of 2019). (Dashed line)
Overall, air travel has been off about 20% relative to 2019 for the last four months (with some ups and downs).
The second graph shows the 7-day average of the year-over-year change in diners as tabulated by OpenTable for the US and several selected cities.
IMPORTANT: OpenTable notes: "we’ve updated the data including downloadable dataset from January 1, 2021 onward to compare seated diners from 2021 to 2019, as opposed to year over year." Thanks!
 Thanks to OpenTable for providing this restaurant data:
This data is updated through November 6, 2021.
This data is "a sample of restaurants on the OpenTable network across all channels: online reservations, phone reservations, and walk-ins. For year-over-year comparisons by day, we compare to the same day of the week from the same week in the previous year."
Note that this data is for "only the restaurants that have chosen to reopen in a given market". Since some restaurants have not reopened, the actual year-over-year decline is worse than shown.
Dining picked up for the Labor Day weekend, but declined after the holiday - and appears to be declining again. The 7-day average for the US is down 14% compared to 2019.
 This data shows domestic box office for each week and the median for the years 2016 through 2019 (dashed light blue).
 Blue is 2020 and Red is 2021.
The data is from BoxOfficeMojo through November 4th.
Note that the data is usually noisy week-to-week and depends on when blockbusters are released.
Movie ticket sales were at $88 million last week, down about 50% from the median for the week.
Note that the data is usually noisy week-to-week and depends on when blockbusters are released.
Movie ticket sales were at $88 million last week, down about 50% from the median for the week.
 This graph shows the seasonal pattern for the hotel occupancy rate using the four week average.
 The red line is for 2021, black is 2020, blue is the median, dashed purple is 2019, and dashed light blue is for 2009 (the worst year on record for hotels prior to 2020).
This data is through October 30th. The occupancy rate was down 5.7% compared to the same week in 2019.
Notes: Y-axis doesn't start at zero to better show the seasonal change.
The occupancy rate will now decline seasonally into the new year.
 This graph, based on weekly data from the U.S. Energy Information Administration (EIA), shows gasoline supplied compared to the same week of 2019.
Blue is for 2020. Red is for 2021.
As of October 29th, gasoline supplied was up 3.9% compared to the same week in 2019.
This was the eighth week so far this year when gasoline supplied was up compared to the same week in 2019 - and consumption is running close to 2019 levels now.
This graph is from Apple mobility. From Apple: "This data is generated by counting the number of requests made to Apple Maps for directions in select countries/regions, sub-regions, and cities." This is just a general guide - people that regularly commute probably don't ask for directions.
There is also some great data on mobility from the Dallas Fed Mobility and Engagement Index. However the index is set "relative to its weekday-specific average over January–February", and is not seasonally adjusted, so we can't tell if an increase in mobility is due to recovery or just the normal increase in the Spring and Summer.
 This data is through November 6th
 for the United States and several selected cities.
The graph is the running 7-day average to remove the impact of weekends.
IMPORTANT: All data is relative to January 13, 2020. This data is NOT Seasonally Adjusted. People walk and drive more when the weather is nice, so I'm just using the transit data.
According to the Apple data directions requests, public transit in the 7 day average for the US is at 111% of the January 2020 level.
New York City is doing well by this metric, but subway usage in NYC is down sharply (next graph).
----- New York City Subway Usage -----
Here is some interesting data on New York subway usage (HT BR).
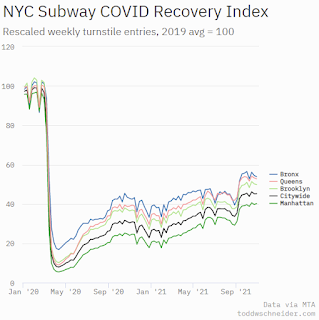 This graph is from Todd W Schneider.
Here is some interesting data on New York subway usage (HT BR).
 This graph is from Todd W Schneider.
 This graph shows how much MTA traffic has recovered in each borough (Graph starts at first week in January 2020 and 100 = 2019 average).
This data is through Friday, November 5th.
He notes: "Data updates weekly from the MTA’s public turnstile data, usually on Saturday mornings".
This data is through Friday, November 5th.
He notes: "Data updates weekly from the MTA’s public turnstile data, usually on Saturday mornings".
Sunday, November 07, 2021
Sunday Night Futures
by Calculated Risk on 11/07/2021 06:13:00 PM
Weekend:
• Schedule for Week of November 7, 2021
Monday:
• At 12:00 PM ET, Speech, Fed Governor Michelle Bowman, The U.S. Housing Market, At the Women in Housing and Finance Public Policy Luncheon, Washington, D.C.
• At 2:00 PM, Senior Loan Officer Opinion Survey on Bank Lending Practices for October.
From CNBC: Pre-Market Data and Bloomberg futures S&P 500 and DOW futures are mostly unchanged (fair value).
Oil prices were down over the last week with WTI futures at $81.27 per barrel and Brent at $82.74 per barrel. A year ago, WTI was at $37, and Brent was at $38 - so WTI oil prices are up more than double year-over-year.
Here is a graph from Gasbuddy.com for nationwide gasoline prices. Nationally prices are at $3.40 per gallon. A year ago prices were at $2.09 per gallon, so gasoline prices are up $1.31 per gallon year-over-year.


