 RSS Feed
 by Calculated Risk on 10/24/2010 11:03:00 PM
Sunday, October 24, 2010
Short Sales vs. Foreclosures
Posted earlier:
Michael Powell at the NY Times looks at short sales and foreclosures: Owners Seek to Sell at a Loss, but Bankers Push Foreclosure
The article offers two explanations for why lenders seem to prefer foreclosures: 1) short sale fraud, and 2) some incentives might favor foreclosure.
From Powell:
[F]inancial incentives can push toward a foreclosure rather than a short sale. Servicers can reap high fees from foreclosures. And lenders can try to collect on private mortgage insurance.In a more normal environment, servicers can "reap high fees" from foreclosures, but in the current environment there is a less of an incentive (since investors are reviewing all expenses closely). And mortgage insurance is a definite stumbling block to some short sales. But there is little evidence of the banks sitting on REOs to avoid taking losses (there just aren't that many REOs on their balance sheets) - so I think that point is incorrect.
Some advocates and real estate agents also point to an April 2009 regulatory change in an obscure federal accounting law. The change, in effect, allowed banks to foreclose on a home without having to write down a loss until that home was sold. By contrast, if a bank agrees to a short sale, it must mark the loss immediately.
When I've spoken to lenders / servicers, short sale fraud is always the first thing they mention. There are all kinds of possible frauds - from non-arms length transactions (selling to friends or relatives), off the record kickbacks to the owner, and "flopping", where the agent presents an offer to the bank from a partner - even though the agents has received higher offers, and then the partner flips the house after the short sale splitting the profits with the agent.
Even with all these problems, and the long waits for buyers, short sales have increased significantly this year.
60 Minutes: Unemployment and the "99ers"
by Calculated Risk on 10/24/2010 08:19:00 PM
Posted earlier:
Here is a preview (here is the link if the embed doesn't work).
Not on preview, but one 99er was asked ...
Q: "What comes next?"
A: "The abyss"
Schedule for Week of Oct 24th
by Calculated Risk on 10/24/2010 01:27:00 PM
The previous post is the Summary for Week ending Oct 23rd
The key economic report for the coming week is the Q3 advance GDP report to be released on Friday. There are also three important housing reports to be released early in the week: Existing home sales on Monday, Case-Shiller house prices on Tuesday, and New Home sales on Wednesday.
CoreLogic House Price Index for August. This release will probably show further declines in house prices. The index is a weighted 3 month average for June, July and August.
Making Home Affordable Program (HAMP) for September and the “Housing Scorecard”
8:30 AM ET: Chicago Fed National Activity Index (September). This is a composite index of other data.
8:30 AM: Fed Chairman Bernanke, Welcoming Remarks at Mortgage Foreclosures and the Future of Housing Finance in Arlington, VA. I don't expect anything newsworthy from Bernanke, but there are a number of interesting topics at this two day conference on housing issues (see agenda at link).
10:00 AM: Existing Home Sales for September from the National Association of Realtors (NAR). The consensus is for an increase to 4.30 million on a Seasonally Adjusted Annual Rate (SAAR) in September from 4.13 million in August. Housing economist Tom Lawler is projecting 4.5 million SAAR. In addition to sales, the level of inventory and months-of-supply will be very important (since months-of-supply impacts prices). Months-of-supply should still be in double digits in September. Note: there will probably be no impact on September sales from the "robo-signer" foreclosure moratorium.
10:30 AM: Dallas Fed Manufacturing Survey for October. The Texas survey showed a slight expansion last month (at 4.0), and is expected to show a slight expansion again in October.
Various Fed Speeches: St. Louis Fed President Bullard (1:30 PM), NY Fed President Dudley (4:30 PM), and Kansas City Fed President Hoenig (8 PM) are all scheduled to speak.
9:00 AM: S&P/Case-Shiller Home Price Index for August. Although this is the August report, it is really a 3 month average of June, July and August. The consensus is for a slight decline in prices month-over-month in August.
10:00 AM: Richmond Fed Survey of Manufacturing Activity for October. The consensus is for the index to be flat after showing contraction (-2) last month.
10:00 AM: 10:00 FHFA House Price Index for August. This is based on GSE repeat sales and is no longer as closely followed as Case-Shiller (or CoreLogic).
10:00 AM: Conference Board's consumer confidence index for October. The consensus is for an increase to 50 from 48.5 last month. This is down sharply from earlier this year.
7:00 AM: The Mortgage Bankers Association (MBA) will release the mortgage purchase applications index. This index declined sharply following the expiration of the tax credit, and the index has only recovered slightly over the last few months even with record low mortgage rates.
8:30 AM: Durable Goods Orders for September from the Census Bureau. The consensus is for a 1.6% increase in durable goods orders after declining 1.3% in August.
10:00 AM: New Home Sales for September from the Census Bureau. The consensus is for a slight increase in sales to 300K (SAAR) in September from 288K in August. New home sales collapsed in and have averaged only 293K (SAAR) over the last four months. Prior to the last four months, the previous record low was 338K in Sept 1981.
8:30 AM: The initial weekly unemployment claims report will be released. Consensus is for about an increase to 455,000 from 452,000 last week (still elevated).
11:00 AM: Kansas City Fed regional Manufacturing Survey for October. The index was at 14 in September.
8:30 AM: Q3 GDP (second release). This is the advance release from the BEA, and the consensus is for real GDP to increase 2.0% annualized. My initial estimate was for a 1.5% annualized real increase in Q3 GDP, and I'll post another preview during the week. This is probably the last economic report standing between the Fed and QE2 (2nd round of quantitative easing). It would take a huge upside surprise in the GDP report to delay QE2 from arriving on November 3rd at 2:15 PM.
8:30 AM: The Q3 Employment Cost Index from the BLS. This is a measure of total compensation costs and the consensus is for 0.5% increase.
9:45 AM: Chicago Purchasing Managers Index for October. The consensus is for a decline to 57.6 from 60.4 in September.
9:55 AM: Reuter's/University of Michigan's Consumer sentiment index (final for October).
After 4:00 PM: The FDIC will probably have another busy Friday afternoon ...
Summary for Week ending Oct 23rd
by Calculated Risk on 10/24/2010 09:00:00 AM
A summary of last week - mostly in graphs.
With all the Fed speeches last week it is clear that the countdown to QE2 continues (QE2: quantitative easing, 2nd round). Also "put-backs" of "soured" mortgages (repurchase demands) is picking up steam, see:
From the Fed: Industrial production and Capacity Utilization
Industrial production decreased 0.2 percent in September after having increased 0.2 percent in August. ... The capacity utilization rate for total industry edged down to 74.7 percent ...
 Click on graph for larger image in new window.
This graph shows Capacity Utilization. This series is up 9.5% from the record low set in June 2009 (the series starts in 1967).
Capacity utilization at 74.7% is still far below normal - and well below the pre-recession levels of 81.2% in November 2007.
 The second graph shows industrial production since 1967.
Industrial production declined slightly in September, and production is still 7.5% below the pre-recession levels at the end of 2007.
This is below consensus expectations of a 0.2% increase in Industrial Production, and an increase to 74.8% (from 74.7% before revision) for Capacity Utilization.
 Total housing starts were at 610 thousand (SAAR) in September, up 0.3% from the revised August rate of 608 thousand (revised up from 598 thousand), and up 28% from the all time record low in April 2009 of 477 thousand (the lowest level since the Census Bureau began tracking housing starts in 1959).
 There has been an increase in multi-family starts over the last two months, although single family starts are significantly below the levels of earlier this year.
Single-family starts increased 4.4% to 452 thousand in August. This is 25% above the record low in January 2009 (360 thousand).
This was above expectations of 580 thousand starts, mostly because of the volatile multi-family starts.
 The National Association of Home Builders (NAHB) reports the housing market index (HMI) was at 16 in October. This is a 3 point increase from 13 in September, and is the highest level since June. The record low was 8 set in January 2009, and 16 is still very low ...
Note: any number under 50 indicates that more builders view sales conditions as poor than good.
This graph compares the NAHB HMI (left scale) with single family housing starts (right scale). This includes the October release for the HMI and the August data for starts (posted before starts were released).
This shows that the HMI and single family starts mostly move in the same direction - although there is plenty of noise month-to-month.
 Moody's reported today that the Moody’s/REAL All Property Type Aggregate Index declined 3.3% in August. This is a repeat sales measure of commercial real estate prices.
Here is a comparison of the Moodys/REAL Commercial Property Price Index (CPPI) and the Case-Shiller composite 20 index.
CRE prices only go back to December 2000.
The Case-Shiller Composite 20 residential index is in blue (with Dec 2000 set to 1.0 to line up the indexes).
It is important to remember that the number of transactions is very low and there are a large percentage of distressed sales.
Note: This index is a leading indicator for new Commercial Real Estate (CRE) investment.
 Reuters reports that the American Institute of Architects’ Architecture Billings Index increased to 50.4 in September from 48.2 in August. Any reading above 50 indicates expansion.
This graph shows the Architecture Billings Index since 1996. This is the first time the index has been above 50 since Jan 2008.
Note: Nonresidential construction includes commercial and industrial facilities like hotels and office buildings, as well as schools, hospitals and other institutions.
According to the AIA, there is an "approximate nine to twelve month lag time between architecture billings and construction spending" on non-residential construction. So, if the index stays at 50 or above, this suggests there will probably be further declines in CRE investment for the next 9 to 12 months.
Here is the Philadelphia Fed Index: Business Outlook Survey
Results from the Business Outlook Survey suggest that regional manufacturing activity was steady in October. Although the broad survey measures showed marginal improvement this month, the new orders index continued to suggest weak demand for manufactured goods.
...
The survey’s broadest measure of manufacturing conditions, the diffusion index of current activity, increased from a reading of –0.7 in September to 1.0 in October.
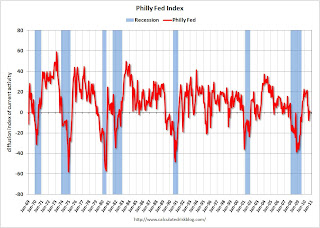 This graph shows the Philly index for the last 40 years.
This index turned down sharply in June and July and was negative in August and September (indicating contraction). The index was barely positive in October, and the internals (new orders, employment) are still weak.
These surveys are timely, but noisy. However this is further evidence of a slowdown in manufacturing. This was slightly worse than the consensus view of a reading of 1.8 (slight expansion).
Best wishes to all.
Saturday, October 23, 2010
Jim the Realtor: Sign Overload
by Calculated Risk on 10/23/2010 09:05:00 PM
The first scene is a classic with all the election signs! Jim says: "Tough time of year for open houses. Aren't you suffering from sign overload right about now?" Yeah, I am!
Jim also update us on some foreclosures and shows us an "estate" in Encinitas (in a mixed neighborhood), and Jim rocks out at the end.
I know the "estate" area very well - that was all flower growers not that many years ago. Some of the land has been sold off to builders, and it looks like some guy bought one plot and built an "estate". Here is the google map of the house (it goes about 70% of the way from Lake to Crest). A little out of character for the immediate neighborhood, and notice all the growers around it.
Number of Bank Failures: 2010 about to surpass 2009
by Calculated Risk on 10/23/2010 05:28:00 PM
I haven't updated these graphs for some time ...
There have been 307 bank failures in this cycle (starting in 2007):
| FDIC Bank Failures by Year | |
|---|---|
| 2007 | 3 |
| 2008 | 25 |
| 2009 | 140 |
| 2010 | 139 |
| Total | 307 |
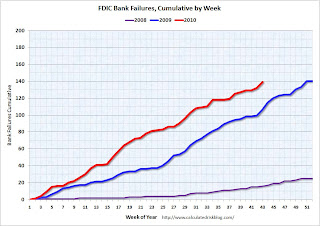 Click on graph for larger image in new window.
This graph shows bank failures by week in 2008, 2009 and 2010.
At this time last year, there were 106 bank failures - on the way to 140 total failures in 2009. This year there are 139 failures so far, and, at this pace, it looks like there will be around 175 total failures in 2010.
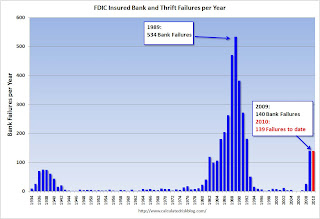 That would be the highest total since the 181 bank failures in 1992.
Bank failures peaked at 534 in 1989 during the S&L crisis.
And on total assets from the December Congressional Oversight Panel’s Troubled Asset Relief Program report:
[A]lthough the number of failed banks was significantly higher in the late 1980s than it is now, the aggregate assets of failed banks during the current crisis far outweighs those from the 1980s. At the high point in 1988 and 1989, 763 banks failed, with total assets of $309 billion. Compare this to 149 banks failing in 2008 and 2009, with total assets of $473 billion.Note: This is in 2005 dollars and doesn't include the failures in 2010 (only estimates are available so far for 2010). However this does include the failure of WaMu in 2008 with $307 billion in assets that didn't impact the DIF.
Impact of BofA Foreclosure Moratorium on North San Diego County
by Calculated Risk on 10/23/2010 01:52:00 PM
Some interesting data for just one small area ...

Graph from North County Times and shows the impact of the BofA foreclosure moratorium on repossessions in a non-judicial area.
This is just in the North San Diego and Southwest Riverside counties.
From Eric Wolff at the NC Times: Foreclosure moratorium takes hold locally
In the first week of the moratorium, starting Oct. 12, the number of houses foreclosed in the region plummeted 27 percent from the previous week, to 173 foreclosure sales, according to ForeclosureRadar.The "foreclosure-gate" scandal had no impact on existing home sales in September (to be released this coming Monday), but will probably have an impact on closed sales in October.
Much of the drop can be attributed to Bank of America's subsidiary ReconTrust NA, which handled 23.7 percent of the region's foreclosures in 2010.
Unofficial Problem Bank List at 871 Institutions
by Calculated Risk on 10/23/2010 08:39:00 AM
Note: this is an unofficial list of Problem Banks compiled only from public sources.
Here is the unofficial problem bank list for Oct 22, 2010.
Changes and comments from surferdude808:
Failures contributed to the Unofficial Problem Bank List changes this week. There were eight removals, with seven because of failure, and four additions, which leaves the list at 871 institutions with assets of $402.2 billion.
Among the removals was the unassisted merger of Citizens National Bank of Springfield ($254 million) into cross-town Empire Bank, Springfield, MO. The failures included Hillcrest Bank ($1.6 billion); First Arizona Savings, a FSB ($272 million); First Suburban National Bank ($149 million); The First National Bank of Barnesville ($136 million); Progress Bank of Florida ($111 million); First Bank of Jacksonville ($81 million); and The Gordon Bank ($29 million).
The First National Bank of Barnesville opened its doors in 1902; thus, it survived the Great Depression but it was not able to weather the Great Recession.
The FDIC could not find a buyer for First Arizona Savings so they will mail insured depositors a check; however, its cost estimate of only 12 percent of assets is the lowest of the night and one-third lower than the next cheapest deposit payoff in this cycle, which was Arcola Homestead Savings Bank at 18.8 percent in June 2010.
The four additions are Gibraltar Private Bank & Trust Co., Coral Gables, FL ($1.6 billion); Wilber National Bank, Oneonta, NY ($929 million Ticker: GIW); Highlands Union Bank, Abingdon, VA ($649 million Ticker: HBKA); and Bank of Maumee, Maumee, OH ($45 million). Gibraltar had purchased about $1.5 billion of assets from Boston Private Bank & Trust Company (Ticker: BPFH) in 2009.
Next week there should be many changes as we expect the FDIC to release its actions for September 2010.
Friday, October 22, 2010
Bank Failure #139: First Arizona Savings, Scottsdale, Arizona
by Calculated Risk on 10/22/2010 09:21:00 PM
First / Arizona / Savings
No / yes / not at all
by Soylent Green is People
From the FDIC: FDIC Approves the Payout of the Insured Deposits of First Arizona Savings, A FSB, Scottsdale, Arizona
As of June 30, 2010, First Arizona Savings, A FSB had approximately $272.2 million in total assets and $198.8 million in total deposits. ... The FDIC estimates the cost of the failure to its Deposit Insurance Fund to be approximately $32.8 million. ... The last institution closed in the state was Towne Bank of Arizona, Mesa, on May 7, 2010.No one wanted this one! That makes 7 today ...
Bank Failures #137 & 138: Kansas and Illinois
by Calculated Risk on 10/22/2010 07:11:00 PM
Federal feeding frenzy
Huge heartland heartburn
by Soylent Green is People
From the FDIC: Seaway Bank and Trust Company, Chicago, Illinois, Assumes All of the Deposits of First Suburban National Bank, Maywood, Illinois
As of June 30, 2010, First Suburban National Bank had approximately $148.7 million in total assets and $140.0 million in total deposits ... The FDIC estimates that the cost to the Deposit Insurance Fund (DIF) will be $31.4 million. .... First Suburban National Bank is the 137th FDIC-insured institution to fail in the nation this year, and the 16th in Illinois.From the FDIC: Hillcrest Bank, National Association, Overland Park, Kansas, Assumes All of the Deposits of Hillcrest Bank, Overland Park, Kansas
As of June 30, 2010, Hillcrest Bank had approximately $1.65 billion in total assets and $1.54 billion in total deposits. ... The FDIC estimates that the cost to the Deposit Insurance Fund (DIF) will be $329.7 million. ... Hillcrest Bank is the 138th FDIC-insured institution to fail in the nation this year, and the third in Kansas.
Bank Failure #136: The First National Bank of Barnesville, Barnesville, Georgia
by Calculated Risk on 10/22/2010 06:27:00 PM
Far too late for Barnsville now
Money's ridden off
by Soylent Green is People
From the FDIC: United Bank, Zebulon, Georgia, Assumes All of the Deposits of The First National Bank of Barnesville, Barnesville, Georgia
As of June 30, 2010, The First National Bank of Barnesville had approximately $131.4 million in total assets and $127.1 million in total deposits. ... The FDIC estimates that the cost to the Deposit Insurance Fund (DIF) will be $33.9 million. ... The First National Bank of Barnesville is the 136th FDIC-insured institution to fail in the nation this year, and the 16th in Georgia.Four down ...
Bank Failures #133 to 135: Florida and Georgia
by Calculated Risk on 10/22/2010 05:09:00 PM
Florida, Georgia failures
A phantom luster
by Soylent Green is People
From the FDIC: Ameris Bank, Moultrie, Georgia, Assumes All of the Deposits of First Bank of Jacksonville, Jacksonville, Florida
As of June 30, 2010, First Bank of Jacksonville had approximately $81.0 million in total assets and $77.3 million in total deposits. ... The FDIC estimates that the cost to the Deposit Insurance Fund (DIF) will be $16.2 million. ... First Bank of Jacksonville is the 133rd FDIC-insured institution to fail in the nation this year, and the 26th in Florida.From the FDIC: Bay Cities Bank, Tampa, Florida, Assumes All of the Deposits of Progress Bank of Florida, Tampa, Florida
As of June 30, 2010, Progress Bank of Florida had approximately $110.7 million in total assets and $101.3 million in total deposits. ... The FDIC estimates that the cost to the Deposit Insurance Fund (DIF) will be $25.0 million. ... Progress Bank of Florida is the 134th FDIC-insured institution to fail in the nation this year, and the 27th in Florida.From the FDIC: Morris Bank, Dublin, Georgia, Assumes All of the Deposits of The Gordon Bank, Gordon, Georgia
As of June 30, 2010, The Gordon Bank had approximately $29.4 million in total assets and $26.7 million in total deposits. ... The FDIC estimates that the cost to the Deposit Insurance Fund (DIF) will be $9.0 million. ... The Gordon Bank is the 135th FDIC-insured institution to fail in the nation this year, and the 15th in Georgia.
Report: 1.2 Million Workers could lose Unemployment Benefits next month
by Calculated Risk on 10/22/2010 04:07:00 PM
From the National Employment Law Project: 1.2 Million Workers Out in the Cold for the Holidays If Congress Fails to Renew Federal Jobless Benefits that Expire November 30th
A new analysis released by the National Employment Law Project today reveals that 1.2 million workers will be cut off of federal jobless benefits by year’s end if Congress fails to renew the federal emergency extensions that expire on November 30th.This doesn't include the '99ers - the workers who have exhausted all available unemployment benefits.
...
Of the 1.2 million workers at risk of losing federal benefits, 387,000 are workers who were recently laid-off and are now receiving the six months (26 weeks) of regular state benefits. After exhausting state benefits, these workers would be left to fend for themselves in a job market with just one job opening for every five unemployed workers and an unemployment rate that has exceeded nine percent for 17 months in a row—with no federal unemployment assistance whatsoever.
Clear Capital: "Sudden and Dramatic Drop in U.S. Home Prices"
by Calculated Risk on 10/22/2010 12:58:00 PM
I usually focus on Case-Shiller and Corelogic repeat sales house price indexes. Case-Shiller is the mostly widely followed, and the Federal Reserve uses Corelogic.
The Clear Capital index is also repeat sales, with a price-per-square-foot model, and is a rolling three months average that can be updated daily. I thought I'd pass along this alert today:
Clear Capital™ Reports Sudden and Dramatic Drop in U.S. Home PricesThe most recent Case-Shiller numbers were for July (actually a three month average of May, June and July). The August numbers will be released next Tuesday (an average of June, July and August) - so there is a significant lag in the numbers.
“Clear Capital’s latest data through October 22 shows even more pronounced price declines than our most recent HDI market report released two weeks ago,” said Dr. Alex Villacorta, senior statistician, Clear Capital. “At the national level, home prices are clearly experiencing a dramatic drop from the tax credit-induced highs, effectively wiping out all of the gains obtained during the flurry of activity just preceding the tax credit expiration.”
This special Clear Capital Home Data Index (HDI) alert shows that national home prices have declined 5.9% in just two months and are now at the same level as in mid April 2010, two weeks prior to the expiration of the recent federal homebuyer tax credit. This significant drop in prices, in advance of the typical winter housing market slowdowns, paints an ominous picture that will likely show up in other home data indices in the coming months.
... if previous correlations between the Clear Capital and S&P/Case-Shiller indices continue as expected, the next two months will show a similar downward trend in S&P/Case Shiller numbers.
State Unemployment Rates in September: "Little changed" from August
by Calculated Risk on 10/22/2010 10:00:00 AM
 Click on graph for larger image in new window.
This graph shows the high and low unemployment rates for each state (and D.C.) since 1976. The red bar is the current unemployment rate (sorted by the current unemployment rate).
Eleven states now have double digit unemployment rates. A number of other states are close.
Nevada tied a series high at 14.4% and now has the highest state unemployment rate. Michigan held the top spot for over 4 years until May.
From the BLS: Regional and State Employment and Unemployment Summary
Regional and state unemployment rates were little changed in September. Twenty-three states and the District of Columbia recorded unemployment rate decreases, 11 states registered rate increases, and 16 states had no rate change, the U.S. Bureau of Labor Statistics reported today.
...
In September, Nevada’s unemployment rate held at 14.4 percent, again the highest among the states. The states with the next highest rates were Michigan, 13.0 percent, and California, 12.4 percent. North Dakota continued to register the lowest jobless rate, 3.7 percent, followed by South Dakota and Nebraska, at 4.4 and 4.6 percent, respectively.
Geithner calls for reducing trade imbalances
by Calculated Risk on 10/22/2010 08:37:00 AM
From a letter .S. Treasury Secretary Timothy Geithner sent to his G-20 counterparts:
“First, G-20 countries should commit to undertake policies consistent with reducing external imbalances below a specified share of GDP over the next few years, recognizing that some exceptions may be required for countries that are structurally large exporters of raw materials. This means that G-20 countries running persistent deficits should boost national savings by adopting credible medium-term fiscal targets consistent with sustainable debt levels and by strengthening export performance.And the proposal has plenty of opposition - no surprise - from the WSJ: G-20 Proposal on Curbing Trade Imbalances Faces Opposition
Conversely, G-20 countries with persistent surpluses should undertake structural, fiscal and exchange rate policies to boost domestic sources of growth and support global demand. Since our current account balances depend on our own policy choices as well as on the policies pursued by other G-20 countries, these commitments require a cooperative effort.
“Second, to facilitate the orderly rebalancing of global demand, G-20 countries should commit to refrain from exchange rate policies designed to achieve competitive advantage by either weakening their currency or preventing the appreciation of an undervalued currency.
G-20 emerging market countries with significantly undervalued currencies and adequate precautionary reserves need to allow their exchange rates to adjust fully over time to levels consistent with economic fundamentals. G-20 advanced countries will work to ensure against excessive volatility and disorderly movement in exchange rates.
Together these actions should reduce the risk of excessive volatility in capital flows for emerging economies that have flexible exchange rates.
Japan and Germany, whose export-led growth models have built up major trade surpluses, are opposing such a solution at the meeting of G-20 finance ministers and central bankers in Gyeongju.
"The idea of setting numerical targets is unrealistic," Japanese Finance Minister Yoshihiko Noda said Friday.
Thursday, October 21, 2010
Shanghai Composite Update
by Calculated Risk on 10/21/2010 10:38:00 PM
Just an update ... it seems like the Shanghai and the S&P 500 (and oil prices too - not shown) are all moving together.

This graph shows the Shanghai SSE Composite Index and the S&P 500 (in blue).
The SSE Composite index is at 2,963.50, up about 14% since late August. The S&P 500 and oil are both up about 10% over the same period.
FOMC and QE2
by Calculated Risk on 10/21/2010 06:17:00 PM
A few people have asked me for a summary of the views of current FOMC members concerning QE2. Although no one has committed, here is my best guess based on recent speeches or other information ... there appears to be a majority of FOMC member who will vote "Yes", not counting the three labeled as "probably".
| Person, Position | FOMC Membership | QE2 Position |
|---|---|---|
| Ben S. Bernanke, Board of Governors, Chairman | FOMC | Yes |
| Janet L. Yellen, Fed Vice Chairman, Board of Governors | FOMC | Yes |
| William C. Dudley, New York, FOMC Vice Chairman | FOMC | Yes |
| James Bullard, St. Louis | FOMC | Yes |
| Elizabeth A. Duke, Board of Governors | FOMC | Yes (probably) |
| Thomas M. Hoenig, Kansas City | FOMC | No |
| Sandra Pianalto, Cleveland | FOMC | Yes |
| Sarah Bloom Raskin, Board of Governors | FOMC | Yes (probably) |
| Eric S. Rosengren, Boston | FOMC | Yes |
| Daniel K. Tarullo, Board of Governors | FOMC | Yes (probably) |
| Kevin M. Warsh, Board of Governors | FOMC | Undecided |
| Charles L. Evans, Chicago | Alternate | Yes |
| Richard W. Fisher, Dallas | Alternate | Undecided |
| Narayana Kocherlakota, Minneapolis | Alternate | Undecided |
| Charles I. Plosser, Philadelphia | Alternate | No |
| Christine M. Cumming, First Vice President, New York | Alternate | Unknown |
Hotel Performance: RevPAR up 9.4% compared to same week in 2009
by Calculated Risk on 10/21/2010 02:17:00 PM
Hotel occupancy is one of several industry specific indicators I follow ...
Important: Even though the occupancy rate is close to 2008 levels, 2010 is a much more difficult year for the hotel industry than 2008. RevPAR (revenue per available room) is up 9.4% compared to 2009, but still down 7.8% compared to 2008 - and 2008 was a very difficult year for the hotel industry.
From HotelNewsNow.com: STR: Economy ADR performance falls short
Overall occupancy increased 8.3% to 63.8%, ADR was up 0.9% to US$100.40, and RevPAR ended the week up 9.4% to US$64.09.The following graph shows the four week moving average for the occupancy rate by week for 2008, 2009 and 2010 (and a median for 2000 through 2007).
 Click on graph for larger image in new window.
Notes: the scale doesn't start at zero to better show the change. The graph shows the 4-week average, not the weekly occupancy rate.
On a 4-week basis, occupancy is up 7.9% compared to last year (the worst year since the Great Depression) and 6.1% below the median for 2000 through 2007.
The occupancy rate is about at the levels of 2008, but RevPAR is still down 7.8%.
Data Source: Smith Travel Research, Courtesy of HotelNewsNow.com
FHFA Projections for Fannie and Freddie draws, and House Price Assumptions
by Calculated Risk on 10/21/2010 11:35:00 AM
From the FHFA: FHFA Releases Projections Showing Range of Potential Draws for Fannie Mae and Freddie Mac
To date, the Enterprises have drawn $148 billion from the Treasury Department under the terms of the [Preferred Stock Purchase Agreements] PSPAs. Under the three scenarios used in the projections, cumulative Enterprise draws range from $221 billion to $363 billion through 2013.The key to the size of future draws is the trajectory of house prices. The following graph shows the three house projections used by the FHFA:
 Click on graph for larger image in new window.
From the FHFA:
Stronger Near-term Recovery (FHFA Scenario 1) “Increased access to credit supports the above baseline growth. As a result, the recent increases in house prices are sustained, although additional increases are minimal in 2010 and 2011.” The peak to-trough decline is 31%. From the trough in 1Q09 to the end of the forecast period house prices increase by 5%.My current projection is for further house price declines of 5% to 10%, as measured by the Case-Shiller and Corelogic repeat sales indexes. That would put the peak-to-trough decline around 36% or so. So my guess is somewhere between scenarios 2 & 3.
Current Baseline (FHFA Scenario 2) "Small remaining home price declines" contribute to a 34% peak-to-trough decline. From the trough in 3Q11 to the end of the forecast period house prices increase by 8%.
Deeper Second Recession (FHFA Scenario 3) “As a result of restricted access to credit and continuing high unemployment, the moderate
rebound in housing construction that occurred over the first half of 2009 not only pauses but reverses course." The peak-to-trough decline is 45%. From the trough in 1Q12 to the end of the forecast period house prices increase by 11%.
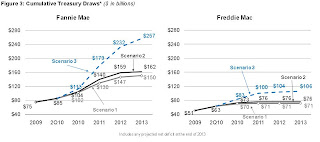 And this graph shows the projected draws for each of the above scenarios.
My guess is the draw will be somewhat over scenario 2, but well below the FHFA's scenario 3.


