 RSS Feed
 by Calculated Risk on 10/23/2010 09:05:00 PM
Saturday, October 23, 2010
Jim the Realtor: Sign Overload
The first scene is a classic with all the election signs! Jim says: "Tough time of year for open houses. Aren't you suffering from sign overload right about now?" Yeah, I am!
Jim also update us on some foreclosures and shows us an "estate" in Encinitas (in a mixed neighborhood), and Jim rocks out at the end.
I know the "estate" area very well - that was all flower growers not that many years ago. Some of the land has been sold off to builders, and it looks like some guy bought one plot and built an "estate". Here is the google map of the house (it goes about 70% of the way from Lake to Crest). A little out of character for the immediate neighborhood, and notice all the growers around it.
Number of Bank Failures: 2010 about to surpass 2009
by Calculated Risk on 10/23/2010 05:28:00 PM
I haven't updated these graphs for some time ...
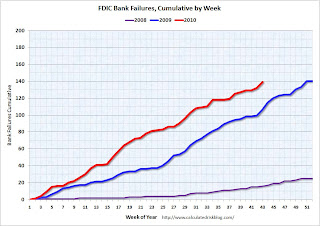
There have been 307 bank failures in this cycle (starting in 2007):
| FDIC Bank Failures by Year | |
|---|---|
| 2007 | 3 |
| 2008 | 25 |
| 2009 | 140 |
| 2010 | 139 |
| Total | 307 |
 Click on graph for larger image in new window.
This graph shows bank failures by week in 2008, 2009 and 2010.
At this time last year, there were 106 bank failures - on the way to 140 total failures in 2009. This year there are 139 failures so far, and, at this pace, it looks like there will be around 175 total failures in 2010.
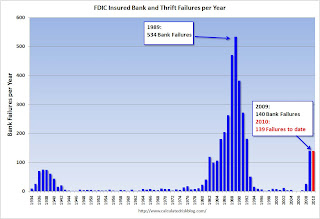 That would be the highest total since the 181 bank failures in 1992.
Bank failures peaked at 534 in 1989 during the S&L crisis.
And on total assets from the December Congressional Oversight Panel’s Troubled Asset Relief Program report:
[A]lthough the number of failed banks was significantly higher in the late 1980s than it is now, the aggregate assets of failed banks during the current crisis far outweighs those from the 1980s. At the high point in 1988 and 1989, 763 banks failed, with total assets of $309 billion. Compare this to 149 banks failing in 2008 and 2009, with total assets of $473 billion.Note: This is in 2005 dollars and doesn't include the failures in 2010 (only estimates are available so far for 2010). However this does include the failure of WaMu in 2008 with $307 billion in assets that didn't impact the DIF.
Impact of BofA Foreclosure Moratorium on North San Diego County
by Calculated Risk on 10/23/2010 01:52:00 PM
Some interesting data for just one small area ...

Graph from North County Times and shows the impact of the BofA foreclosure moratorium on repossessions in a non-judicial area.
This is just in the North San Diego and Southwest Riverside counties.
From Eric Wolff at the NC Times: Foreclosure moratorium takes hold locally
In the first week of the moratorium, starting Oct. 12, the number of houses foreclosed in the region plummeted 27 percent from the previous week, to 173 foreclosure sales, according to ForeclosureRadar.The "foreclosure-gate" scandal had no impact on existing home sales in September (to be released this coming Monday), but will probably have an impact on closed sales in October.
Much of the drop can be attributed to Bank of America's subsidiary ReconTrust NA, which handled 23.7 percent of the region's foreclosures in 2010.
Unofficial Problem Bank List at 871 Institutions
by Calculated Risk on 10/23/2010 08:39:00 AM
Note: this is an unofficial list of Problem Banks compiled only from public sources.
Here is the unofficial problem bank list for Oct 22, 2010.
Changes and comments from surferdude808:
Failures contributed to the Unofficial Problem Bank List changes this week. There were eight removals, with seven because of failure, and four additions, which leaves the list at 871 institutions with assets of $402.2 billion.
Among the removals was the unassisted merger of Citizens National Bank of Springfield ($254 million) into cross-town Empire Bank, Springfield, MO. The failures included Hillcrest Bank ($1.6 billion); First Arizona Savings, a FSB ($272 million); First Suburban National Bank ($149 million); The First National Bank of Barnesville ($136 million); Progress Bank of Florida ($111 million); First Bank of Jacksonville ($81 million); and The Gordon Bank ($29 million).
The First National Bank of Barnesville opened its doors in 1902; thus, it survived the Great Depression but it was not able to weather the Great Recession.
The FDIC could not find a buyer for First Arizona Savings so they will mail insured depositors a check; however, its cost estimate of only 12 percent of assets is the lowest of the night and one-third lower than the next cheapest deposit payoff in this cycle, which was Arcola Homestead Savings Bank at 18.8 percent in June 2010.
The four additions are Gibraltar Private Bank & Trust Co., Coral Gables, FL ($1.6 billion); Wilber National Bank, Oneonta, NY ($929 million Ticker: GIW); Highlands Union Bank, Abingdon, VA ($649 million Ticker: HBKA); and Bank of Maumee, Maumee, OH ($45 million). Gibraltar had purchased about $1.5 billion of assets from Boston Private Bank & Trust Company (Ticker: BPFH) in 2009.
Next week there should be many changes as we expect the FDIC to release its actions for September 2010.
Friday, October 22, 2010
Bank Failure #139: First Arizona Savings, Scottsdale, Arizona
by Calculated Risk on 10/22/2010 09:21:00 PM
First / Arizona / Savings
No / yes / not at all
by Soylent Green is People
From the FDIC: FDIC Approves the Payout of the Insured Deposits of First Arizona Savings, A FSB, Scottsdale, Arizona
As of June 30, 2010, First Arizona Savings, A FSB had approximately $272.2 million in total assets and $198.8 million in total deposits. ... The FDIC estimates the cost of the failure to its Deposit Insurance Fund to be approximately $32.8 million. ... The last institution closed in the state was Towne Bank of Arizona, Mesa, on May 7, 2010.No one wanted this one! That makes 7 today ...
Bank Failures #137 & 138: Kansas and Illinois
by Calculated Risk on 10/22/2010 07:11:00 PM
Federal feeding frenzy
Huge heartland heartburn
by Soylent Green is People
From the FDIC: Seaway Bank and Trust Company, Chicago, Illinois, Assumes All of the Deposits of First Suburban National Bank, Maywood, Illinois
As of June 30, 2010, First Suburban National Bank had approximately $148.7 million in total assets and $140.0 million in total deposits ... The FDIC estimates that the cost to the Deposit Insurance Fund (DIF) will be $31.4 million. .... First Suburban National Bank is the 137th FDIC-insured institution to fail in the nation this year, and the 16th in Illinois.From the FDIC: Hillcrest Bank, National Association, Overland Park, Kansas, Assumes All of the Deposits of Hillcrest Bank, Overland Park, Kansas
As of June 30, 2010, Hillcrest Bank had approximately $1.65 billion in total assets and $1.54 billion in total deposits. ... The FDIC estimates that the cost to the Deposit Insurance Fund (DIF) will be $329.7 million. ... Hillcrest Bank is the 138th FDIC-insured institution to fail in the nation this year, and the third in Kansas.
Bank Failure #136: The First National Bank of Barnesville, Barnesville, Georgia
by Calculated Risk on 10/22/2010 06:27:00 PM
Far too late for Barnsville now
Money's ridden off
by Soylent Green is People
From the FDIC: United Bank, Zebulon, Georgia, Assumes All of the Deposits of The First National Bank of Barnesville, Barnesville, Georgia
As of June 30, 2010, The First National Bank of Barnesville had approximately $131.4 million in total assets and $127.1 million in total deposits. ... The FDIC estimates that the cost to the Deposit Insurance Fund (DIF) will be $33.9 million. ... The First National Bank of Barnesville is the 136th FDIC-insured institution to fail in the nation this year, and the 16th in Georgia.Four down ...
Bank Failures #133 to 135: Florida and Georgia
by Calculated Risk on 10/22/2010 05:09:00 PM
Florida, Georgia failures
A phantom luster
by Soylent Green is People
From the FDIC: Ameris Bank, Moultrie, Georgia, Assumes All of the Deposits of First Bank of Jacksonville, Jacksonville, Florida
As of June 30, 2010, First Bank of Jacksonville had approximately $81.0 million in total assets and $77.3 million in total deposits. ... The FDIC estimates that the cost to the Deposit Insurance Fund (DIF) will be $16.2 million. ... First Bank of Jacksonville is the 133rd FDIC-insured institution to fail in the nation this year, and the 26th in Florida.From the FDIC: Bay Cities Bank, Tampa, Florida, Assumes All of the Deposits of Progress Bank of Florida, Tampa, Florida
As of June 30, 2010, Progress Bank of Florida had approximately $110.7 million in total assets and $101.3 million in total deposits. ... The FDIC estimates that the cost to the Deposit Insurance Fund (DIF) will be $25.0 million. ... Progress Bank of Florida is the 134th FDIC-insured institution to fail in the nation this year, and the 27th in Florida.From the FDIC: Morris Bank, Dublin, Georgia, Assumes All of the Deposits of The Gordon Bank, Gordon, Georgia
As of June 30, 2010, The Gordon Bank had approximately $29.4 million in total assets and $26.7 million in total deposits. ... The FDIC estimates that the cost to the Deposit Insurance Fund (DIF) will be $9.0 million. ... The Gordon Bank is the 135th FDIC-insured institution to fail in the nation this year, and the 15th in Georgia.
Report: 1.2 Million Workers could lose Unemployment Benefits next month
by Calculated Risk on 10/22/2010 04:07:00 PM
From the National Employment Law Project: 1.2 Million Workers Out in the Cold for the Holidays If Congress Fails to Renew Federal Jobless Benefits that Expire November 30th
A new analysis released by the National Employment Law Project today reveals that 1.2 million workers will be cut off of federal jobless benefits by year’s end if Congress fails to renew the federal emergency extensions that expire on November 30th.This doesn't include the '99ers - the workers who have exhausted all available unemployment benefits.
...
Of the 1.2 million workers at risk of losing federal benefits, 387,000 are workers who were recently laid-off and are now receiving the six months (26 weeks) of regular state benefits. After exhausting state benefits, these workers would be left to fend for themselves in a job market with just one job opening for every five unemployed workers and an unemployment rate that has exceeded nine percent for 17 months in a row—with no federal unemployment assistance whatsoever.
Clear Capital: "Sudden and Dramatic Drop in U.S. Home Prices"
by Calculated Risk on 10/22/2010 12:58:00 PM
I usually focus on Case-Shiller and Corelogic repeat sales house price indexes. Case-Shiller is the mostly widely followed, and the Federal Reserve uses Corelogic.
The Clear Capital index is also repeat sales, with a price-per-square-foot model, and is a rolling three months average that can be updated daily. I thought I'd pass along this alert today:
Clear Capital™ Reports Sudden and Dramatic Drop in U.S. Home PricesThe most recent Case-Shiller numbers were for July (actually a three month average of May, June and July). The August numbers will be released next Tuesday (an average of June, July and August) - so there is a significant lag in the numbers.
“Clear Capital’s latest data through October 22 shows even more pronounced price declines than our most recent HDI market report released two weeks ago,” said Dr. Alex Villacorta, senior statistician, Clear Capital. “At the national level, home prices are clearly experiencing a dramatic drop from the tax credit-induced highs, effectively wiping out all of the gains obtained during the flurry of activity just preceding the tax credit expiration.”
This special Clear Capital Home Data Index (HDI) alert shows that national home prices have declined 5.9% in just two months and are now at the same level as in mid April 2010, two weeks prior to the expiration of the recent federal homebuyer tax credit. This significant drop in prices, in advance of the typical winter housing market slowdowns, paints an ominous picture that will likely show up in other home data indices in the coming months.
... if previous correlations between the Clear Capital and S&P/Case-Shiller indices continue as expected, the next two months will show a similar downward trend in S&P/Case Shiller numbers.
State Unemployment Rates in September: "Little changed" from August
by Calculated Risk on 10/22/2010 10:00:00 AM
 Click on graph for larger image in new window.
This graph shows the high and low unemployment rates for each state (and D.C.) since 1976. The red bar is the current unemployment rate (sorted by the current unemployment rate).
Eleven states now have double digit unemployment rates. A number of other states are close.
Nevada tied a series high at 14.4% and now has the highest state unemployment rate. Michigan held the top spot for over 4 years until May.
From the BLS: Regional and State Employment and Unemployment Summary
Regional and state unemployment rates were little changed in September. Twenty-three states and the District of Columbia recorded unemployment rate decreases, 11 states registered rate increases, and 16 states had no rate change, the U.S. Bureau of Labor Statistics reported today.
...
In September, Nevada’s unemployment rate held at 14.4 percent, again the highest among the states. The states with the next highest rates were Michigan, 13.0 percent, and California, 12.4 percent. North Dakota continued to register the lowest jobless rate, 3.7 percent, followed by South Dakota and Nebraska, at 4.4 and 4.6 percent, respectively.
Geithner calls for reducing trade imbalances
by Calculated Risk on 10/22/2010 08:37:00 AM
From a letter .S. Treasury Secretary Timothy Geithner sent to his G-20 counterparts:
“First, G-20 countries should commit to undertake policies consistent with reducing external imbalances below a specified share of GDP over the next few years, recognizing that some exceptions may be required for countries that are structurally large exporters of raw materials. This means that G-20 countries running persistent deficits should boost national savings by adopting credible medium-term fiscal targets consistent with sustainable debt levels and by strengthening export performance.And the proposal has plenty of opposition - no surprise - from the WSJ: G-20 Proposal on Curbing Trade Imbalances Faces Opposition
Conversely, G-20 countries with persistent surpluses should undertake structural, fiscal and exchange rate policies to boost domestic sources of growth and support global demand. Since our current account balances depend on our own policy choices as well as on the policies pursued by other G-20 countries, these commitments require a cooperative effort.
“Second, to facilitate the orderly rebalancing of global demand, G-20 countries should commit to refrain from exchange rate policies designed to achieve competitive advantage by either weakening their currency or preventing the appreciation of an undervalued currency.
G-20 emerging market countries with significantly undervalued currencies and adequate precautionary reserves need to allow their exchange rates to adjust fully over time to levels consistent with economic fundamentals. G-20 advanced countries will work to ensure against excessive volatility and disorderly movement in exchange rates.
Together these actions should reduce the risk of excessive volatility in capital flows for emerging economies that have flexible exchange rates.
Japan and Germany, whose export-led growth models have built up major trade surpluses, are opposing such a solution at the meeting of G-20 finance ministers and central bankers in Gyeongju.
"The idea of setting numerical targets is unrealistic," Japanese Finance Minister Yoshihiko Noda said Friday.
Thursday, October 21, 2010
Shanghai Composite Update
by Calculated Risk on 10/21/2010 10:38:00 PM
Just an update ... it seems like the Shanghai and the S&P 500 (and oil prices too - not shown) are all moving together.

This graph shows the Shanghai SSE Composite Index and the S&P 500 (in blue).
The SSE Composite index is at 2,963.50, up about 14% since late August. The S&P 500 and oil are both up about 10% over the same period.
FOMC and QE2
by Calculated Risk on 10/21/2010 06:17:00 PM
A few people have asked me for a summary of the views of current FOMC members concerning QE2. Although no one has committed, here is my best guess based on recent speeches or other information ... there appears to be a majority of FOMC member who will vote "Yes", not counting the three labeled as "probably".
| Person, Position | FOMC Membership | QE2 Position |
|---|---|---|
| Ben S. Bernanke, Board of Governors, Chairman | FOMC | Yes |
| Janet L. Yellen, Fed Vice Chairman, Board of Governors | FOMC | Yes |
| William C. Dudley, New York, FOMC Vice Chairman | FOMC | Yes |
| James Bullard, St. Louis | FOMC | Yes |
| Elizabeth A. Duke, Board of Governors | FOMC | Yes (probably) |
| Thomas M. Hoenig, Kansas City | FOMC | No |
| Sandra Pianalto, Cleveland | FOMC | Yes |
| Sarah Bloom Raskin, Board of Governors | FOMC | Yes (probably) |
| Eric S. Rosengren, Boston | FOMC | Yes |
| Daniel K. Tarullo, Board of Governors | FOMC | Yes (probably) |
| Kevin M. Warsh, Board of Governors | FOMC | Undecided |
| Charles L. Evans, Chicago | Alternate | Yes |
| Richard W. Fisher, Dallas | Alternate | Undecided |
| Narayana Kocherlakota, Minneapolis | Alternate | Undecided |
| Charles I. Plosser, Philadelphia | Alternate | No |
| Christine M. Cumming, First Vice President, New York | Alternate | Unknown |
Hotel Performance: RevPAR up 9.4% compared to same week in 2009
by Calculated Risk on 10/21/2010 02:17:00 PM
Hotel occupancy is one of several industry specific indicators I follow ...
Important: Even though the occupancy rate is close to 2008 levels, 2010 is a much more difficult year for the hotel industry than 2008. RevPAR (revenue per available room) is up 9.4% compared to 2009, but still down 7.8% compared to 2008 - and 2008 was a very difficult year for the hotel industry.
From HotelNewsNow.com: STR: Economy ADR performance falls short
Overall occupancy increased 8.3% to 63.8%, ADR was up 0.9% to US$100.40, and RevPAR ended the week up 9.4% to US$64.09.The following graph shows the four week moving average for the occupancy rate by week for 2008, 2009 and 2010 (and a median for 2000 through 2007).
 Click on graph for larger image in new window.
Notes: the scale doesn't start at zero to better show the change. The graph shows the 4-week average, not the weekly occupancy rate.
On a 4-week basis, occupancy is up 7.9% compared to last year (the worst year since the Great Depression) and 6.1% below the median for 2000 through 2007.
The occupancy rate is about at the levels of 2008, but RevPAR is still down 7.8%.
Data Source: Smith Travel Research, Courtesy of HotelNewsNow.com
FHFA Projections for Fannie and Freddie draws, and House Price Assumptions
by Calculated Risk on 10/21/2010 11:35:00 AM
From the FHFA: FHFA Releases Projections Showing Range of Potential Draws for Fannie Mae and Freddie Mac
To date, the Enterprises have drawn $148 billion from the Treasury Department under the terms of the [Preferred Stock Purchase Agreements] PSPAs. Under the three scenarios used in the projections, cumulative Enterprise draws range from $221 billion to $363 billion through 2013.The key to the size of future draws is the trajectory of house prices. The following graph shows the three house projections used by the FHFA:
 Click on graph for larger image in new window.
From the FHFA:
Stronger Near-term Recovery (FHFA Scenario 1) “Increased access to credit supports the above baseline growth. As a result, the recent increases in house prices are sustained, although additional increases are minimal in 2010 and 2011.” The peak to-trough decline is 31%. From the trough in 1Q09 to the end of the forecast period house prices increase by 5%.My current projection is for further house price declines of 5% to 10%, as measured by the Case-Shiller and Corelogic repeat sales indexes. That would put the peak-to-trough decline around 36% or so. So my guess is somewhere between scenarios 2 & 3.
Current Baseline (FHFA Scenario 2) "Small remaining home price declines" contribute to a 34% peak-to-trough decline. From the trough in 3Q11 to the end of the forecast period house prices increase by 8%.
Deeper Second Recession (FHFA Scenario 3) “As a result of restricted access to credit and continuing high unemployment, the moderate
rebound in housing construction that occurred over the first half of 2009 not only pauses but reverses course." The peak-to-trough decline is 45%. From the trough in 1Q12 to the end of the forecast period house prices increase by 11%.
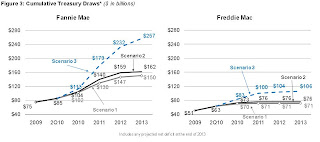 And this graph shows the projected draws for each of the above scenarios.
My guess is the draw will be somewhat over scenario 2, but well below the FHFA's scenario 3.
Philly Fed Index "steady" in October
by Calculated Risk on 10/21/2010 10:00:00 AM
Here is the Philadelphia Fed Index: Business Outlook Survey
Results from the Business Outlook Survey suggest that regional manufacturing activity was steady in October. Although the broad survey measures showed marginal improvement this month, the new orders index continued to suggest weak demand for manufactured goods.
...
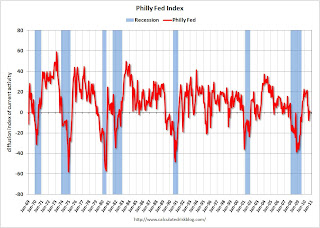
The survey’s broadest measure of manufacturing conditions, the diffusion index of current activity, increased from a reading of –0.7 in September to 1.0 in October. The index had been negative for two consecutive months (see Chart). Indexes for new orders and shipments continued to indicate weakness this month: The new orders index increased 3 points but remained negative for the fourth consecutive month.
...
Firms reported near steady employment again this month, but lower average work hours for existing employees. The percentage of firms reporting increases in employment (20 percent) narrowly edged out the percentage of firms reporting decreases (17 percent). The index for employment was slightly positive for the second consecutive month but increased just 1 point. Indicative of still weak activity, more firms reported declines in average work hours for existing employees (22 percent) than reported increases (16 percent).emphasis added
 Click on graph for larger image in new window.
This graph shows the Philly index for the last 40 years.
This index turned down sharply in June and July and was negative in August and September (indicating contraction). The index was barely positive in October, and the internals (new orders, employment) are still weak.
These surveys are timely, but noisy. However this is further evidence of a slowdown in manufacturing. This was slightly worse than the consensus view of a reading of 1.8 (slight expansion).
Weekly Initial Unemployment Claims: Moving Sideways
by Calculated Risk on 10/21/2010 08:40:00 AM
The DOL reports on weekly unemployment insurance claims:
In the week ending Oct. 16, the advance figure for seasonally adjusted initial claims was 452,000, a decrease of 23,000 from the previous week's revised figure of 475,000 [revised up from 462,000]. The 4-week moving average was 458,000, a decrease of 4,250 from the previous week's revised average of 462,250.
 Click on graph for larger image in new window.
This graph shows the 4-week moving average of weekly claims since January 2000.
The dashed line on the graph is the current 4-week average. The four-week average of weekly unemployment claims decreased this week by 4,250 to 458,000.
The 4-week moving average has been moving sideways at an elevated level since last December - almost a year - and that suggests a weak job market.
Note: most revisions have been slightly up over the last year or so. The average revision has been up just over 2,000, but the revision last week was up 13,000.
Wednesday, October 20, 2010
WSJ: Here come the GSE Put-Backs
by Calculated Risk on 10/20/2010 10:56:00 PM
From Nick Timiraos at the WSJ: Regulator for Fannie Set to Get Litigious
[The FHFA] hired a law firm specializing in litigation as the agency considers how to move forward with efforts to recoup billions of dollars on soured mortgage-backed securities purchased from banks and Wall Street firms.Back in July, the Federal Housing Finance Agency announced: FHFA Issues Subpoenas for PLS Documents
...
In a statement, the FHFA said it is analyzing requested information and that "no decisions for future action have been made."
FHFA, as Conservator of Fannie Mae and Freddie Mac (the Enterprises), has issued 64 subpoenas to various entities, seeking documents related to private-label mortgage-backed securities (PLS) in which the two Enterprises invested. The documents will enable the FHFA to determine whether PLS issuers and others are liable to the Enterprises for certain losses they have suffered on PLS.The GSEs have a huge advantage over other investors because the FHFA can issue subpoenas. The article mentions estimates that the banks could face put-backs ranging from $24 billion to as high as $179 billion. Quite a range and the actual amount will probably be towards the lower end of the range, and this will play out over a long period (unless there is a settlement).
Note: It is difficult for private investors to obtain the actual loan documents - and that is one of the hurdles the investors asking BofA to repurchase loans need to overcome. Yves Smith at Naked Capitalism points out some of the difficulties: More on Why the PIMCO, BlackRock, Freddie, NY Fed Letter to Countrywide on Putbacks Is Way Overhyped. However the private investors can obtain the required voting rights (usually 25% to 50% depending on the deal), and essentially force the trustee to make the servicer turnover the loan documentation. As I mentioned last night, put-backs could be a big issue for the banks, although I think it will play out over several years and not be a serious issue for the economy.
Comerica and Wells Fargo: Some color on C&I borrowing
by Calculated Risk on 10/20/2010 07:03:00 PM
Just a little color ... this sounds like a sluggish recovery with little new investment. The following comments from Comerica and Wells Fargo on Commercial & Industrial (C&I) lending this morning are mixed. Perhaps a little improvement, but not much. Here are the excerpts from the transcripts (ht Brian).
From Comerica Incorporated conference call:
Analyst: Can you talk about what you saw from your more traditional borrowers during the quarter? Any signs of lines being drawn down or increased optimism?And from Wells Fargo:
Dale Green, EVP, Comerica: Yeah, this is Dale. Number one, as we indicated, the usage was up a bit from about 45% to about 46%, it’s good to see that. We haven’t seen that in a while. If you look at the backlogs and you look at the growth from new customers, and increases to existing customers, it’s kind of spread across most of our businesses. Currently the dealer business is showing growth. The energy business has indicated they are showing growth, those backlogs continue to look good, and what we call the commitments to commit, or the approved deals that we’re waiting to close are up rather substantially this quarter over last quarter, and again, that’s generally across most of the segments. Middle market, technology and life sciences, and so forth. So the quality of the backlog, if you will, is good in the sense that there are more deals that have been approved that are waiting to close, and the level of activity is generally a little better than it’s been. So I would say that we are cautiously optimistic, but you know, this is an uncertain time. So while we’re seeing some improvements, and we’re happy to see it, we’re happy to see better usage, there’s still an economy here that most business people will tell you is concerning, troubling, uncertain.
...
Analyst: I know you talked about utilization rate and everything in terms of demand firming up on commercial lending, but just trying to get an idea of how soon we can see growth commercial offset so CRE roll off in terms of loan growth.
Dale Greene: I hope soon, but the reality is that number one, in terms of new CRE types of opportunities, there are very few new opportunities, so we’ll continue to see the run off of the commercial real estate book as part of a design, if you will. Clearly, as we talked about before, is I had one against growth. While we are seeing some positive trends in the non-CRE, the rest of the C & I book – it’s still very difficult to predict, because there’s just that uncertainty, and so I wouldn’t sit here and tell you exactly when you might see it. It might be a while. I mean, John talked about unemployment rates, and the growth and the economy still being on very muted labels. I don’t know that that’s going to change anytime in the near term, therefore, what we’re doing is the things we’ve done for years. We’re calling on customers, we’re calling on prospects, we’re looking for the core middle market opportunities, particularly in Texas and California. We have loads of good opportunities, we have a better quality backlog, but it will take some time, I think, to see any significant growth, if you will, in the C & I book. It’s just going to be sort of ongoing, quarter to quarter, a block and a tackle kind of an effort.
Ralph Babb, CEO: As Dale was mentioning, we’re staying very close to our customers, and what we’re hearing from our customers, and we have a lot of customers who are doing very well. They are not, because of the uncertainty in the economy, and other things that affect their particular business, investing for the future. They’re really taking care of what’s happening today, and until there is a confidence factor build out there along with the economy showing a steady improvement, I don’t think you’re going to see loans consistently pick up in the industry. You monitor the numbers, I’m sure, just like we do, as to how the industry in total is working. We saw a little bit of that in Q1 and Q2, where things began to pick up, and then all of a sudden the economy slowed back down again, and the estimates that I’ve heard and look at, over the next couple of quarters and into next year, are not significant in pickup. I hope that that’s not correct.
Analyst: So what is the percentage of the C&I loan utilization? I will use that as a measure for how much loan demand there is. What is your feeling about loan demand?
WFC CFO: Roughly in the low 30s on commercial line utilization, and that has been relatively consistent for a couple of quarters now. Again as we say, we are seeing somewhat increased activity, but it is not as robust as we would like to see it be. As I said we think we are picking up market share because we have got so many relationships and all the other cross-sell. So we'll just have to see when demand comes back.
WFC CEO: One of the keys, is our increase in commitments is much greater than what is happening in the portfolio, the outstandings. So we are making investments today, spending money today, to win new clients, service existing clients, that we're not seeing the benefit of yet.


