 RSS Feed
 by Calculated Risk on 9/15/2010 03:44:00 PM
Wednesday, September 15, 2010
Quote of the Day from Time Warner Cable: "anemic new home formation"
Via Dow Jones (ht Brian):
Time Warner Cable ... CFO Robert Marcus said "subscriber environment very, very weak," thanks to high unemployment, high ... vacancies and "really anemic new home formation."Although housing completions are at a record low (adding few net new housing units to the housing stock), additional household formation is key to absorbing the overhang of excess housing units.
Cartoon: "Signs of the Times"
by Calculated Risk on 9/15/2010 02:47:00 PM
From cartoonist Eric G. Lewis:

CoreLogic: House Prices decline 0.6% in July
by Calculated Risk on 9/15/2010 11:18:00 AM
Notes: CoreLogic reports the year-over-year change. The headline for this post is for the change from June 2010 to July 2010. The CoreLogic HPI is a three month weighted average of May, June and July and is NSA.
From CoreLogic (formerly First American LoanPerformance): CoreLogic Home Price Index Remained Flat in July
CoreLogic ... today released its Home Price Index (HPI) that showed that home prices in the U.S. remained flat in July as transaction volumes continue to decline. This was the first time in five months that no year-over-year gains were reported. According to the CoreLogic HPI, national home prices, including distressed sales showed no change in July 2010 compared to July 2009. June 2010 HPI showed a 2.4 percent year-over-year gain compared to June 2009. ...
Although home prices were flat nationally, the majority of states experienced price declines and price declines are spreading across more geographies relative to a few months ago. Home prices fell in 36 states in July, nearly twice the number in May and the highest since last November when national home prices were declining," said Mark Fleming, chief economist for CoreLogic.
 Click on graph for larger image in new window.
 This graph shows the national CoreLogic HPI data since 1976. January 2000 = 100.
The index is flat over the last year, and off 28% from the peak.
The index is 6.1% above the low set in March 2009, and I expect to see a new post-bubble low for this index later this year or early in 2011.
Industrial Production, Capacity Utilization increase in August
by Calculated Risk on 9/15/2010 09:15:00 AM
From the Fed: Industrial production and Capacity Utilization
Industrial production rose 0.2 percent in August after a downwardly revised increase of 0.6 percent in July [revised down from 1.0 percent]. ... The index for manufacturing output rose 0.2 percent in August after having advanced 0.7 percent in July; the step-down in the rate of increase reflected a fallback in the production of motor vehicles and parts, which had jumped sharply in July. Excluding motor vehicles and parts, manufacturing output increased 0.5 percent in August after having gained 0.2 percent in July. ... At 93.2 percent of its 2007 average, total industrial production in August was 6.2 percent above its year-earlier level. The capacity utilization rate for total industry rose to 74.7 percent, a rate 4.7 percentage points above the rate from a year earlier and 5.9 percentage points below its average from 1972 to 2009.
 Click on graph for larger image in new window.
This graph shows Capacity Utilization. This series is up 9.6% from the record low set in June 2009 (the series starts in 1967).
Capacity utilization at 74.7% is still far below normal - and well below the the pre-recession levels of 81.2% in November 2007. (Note: this is actual a decrease before the revision to July)
Note: y-axis doesn't start at zero to better show the change.
 The second graph shows industrial production since 1967.
This is the highest level for industrial production since Oct 2008, but production is still 7.2% below the pre-recession levels at the end of 2007.
The increase in August was about consensus, however the sharp downward revision to July puts this below consensus.
NY Fed: Manufacturing Index declines slightly in September
by Calculated Risk on 9/15/2010 08:30:00 AM
From the NY Fed: Empire State Manufacturing Survey
The Empire State Manufacturing Survey indicates that conditions held relatively steady in New York’s manufacturing sector in September. The general business conditions index remained positive, although it slipped 3 points to 4.1. The new orders and shipments indexes were both up moderately for the month, at levels signaling stable activity.These regional surveys have been showing a slowdown in manufacturing and are being closely watched right now. This was slightly below expectations.
...
Employment indexes were positive, suggesting that employment levels and the average workweek continued to expand over the month. The degree of optimism about the six-month outlook continued to deteriorate, with the future general business conditions index hitting its lowest level since early 2009.
MBA: Mortgage Purchase Activity decreases slightly
by Calculated Risk on 9/15/2010 07:14:00 AM
The MBA reports: Mortgage Applications Decrease in Latest MBA Weekly Survey
The Refinance Index decreased 10.8 percent from the previous week. The seasonally adjusted Purchase Index decreased 0.4 percent from one week earlier.
...
The average contract interest rate for 30-year fixed-rate mortgages decreased to 4.47 percent from 4.50 percent, with points increasing to 1.08 from 0.96 (including the origination fee) for 80 percent loan-to-value (LTV) ratio loans.
 Click on graph for larger image in new window.
This graph shows the MBA Purchase Index and four week moving average since 1990.
Purchase applications are at about the levels of 1996 or 1997, suggesting existing home sales (closed transactions) in August, September and even October, will only be slightly higher than in July. Note: economist Tom Lawler's "early read" is for August existing home sales of 4.1 million SAAR.
Tuesday, September 14, 2010
LA Port Traffic in August: Imports Surge, Exports down year-over-year
by Calculated Risk on 9/14/2010 09:28:00 PM
Notes: this data is not seasonally adjusted. There is a very distinct seasonal pattern for imports, but not for exports. LA area ports handle about 40% of the nation's container port traffic.
The following graph shows the loaded inbound and outbound traffic at the ports of Los Angeles and Long Beach in TEUs (TEUs: 20-foot equivalent units or 20-foot-long cargo container). Although containers tell us nothing about value, container traffic does give us an idea of the volume of goods being exported and imported. Click on graph for larger image in new window.
Loaded inbound traffic was up 24% compared to August 2009. Inbound traffic is now up 4% vs. two years ago (August '08).
Loaded outbound traffic was down 2.6% from August 2009. Unlike imports, exports are still off from 2 years ago (off 17%).
For imports there is usually a significant dip in either February or March, depending on the timing of the Chinese New Year, and then usually imports increase until late summer or early fall as retailers build inventory for the holiday season. So part of this increase in August imports is just the normal seasonal pattern.
Based on this data, it appears the trade deficit with Asia increased again in August. Not only have the pre-crisis global imbalances returned, but exports appear to have peaked in May (no clear seasonal pattern), and have moved sideways or down over the last 6 months.
Lawler: "Early read" on August existing home sales
by Calculated Risk on 9/14/2010 05:50:00 PM
CR Note: This is from housing economist Tom Lawler:
The “early read” on existing home sales based on regional data suggests that existing home sales ran at a seasonally adjusted annual rate of around 4.1 million in August, up around 7% from July’s pace.
My “best guess” right now on the pending home sales index is that it will show a seasonally adjusted increase from July to August of around 4%.
CR Note: some bounce back was expected. This would put the months of supply around 11.5 months. This sales rate would be at about the levels of 1996 or 1997. Existing home sales for August will be released next week on Thursday (Sept 23rd).
Ceridian-UCLA: Diesel Fuel index declines in August, "signals struggling economy"
by Calculated Risk on 9/14/2010 03:30:00 PM
This is the new UCLA Anderson Forecast and Ceridian Corporation index using real-time diesel fuel consumption data: Pulse of Commerce IndexTM
Press Release: August PCI Decline Signals Struggling Economy, but no Double-Dip
The Ceridian-UCLA Pulse of Commerce Index™ (PCI) by UCLA Anderson School of Management fell 1 percent in August, a disappointing number that closes out an erratic summer in the PCI.
...
“The August data is obviously discouraging after the cautious optimism created from July’s report,” said Ed Leamer, chief PCI economist. “There is not much to feel good about with the August data in terms of the unemployment picture, but there is a silver lining in that the August PCI is still far from double-dip territory."
...
“The restocking of inventory and exceptional growth in imports that were helping drive the transportation of goods and materials appears to be over,” said Craig Manson, senior vice president and index expert for Ceridian.
...
The PCI is based on an analysis of real-time diesel fuel consumption data from over the road trucking tracked by Ceridian ...
 Click on graph for larger image in new window.
This graph shows the index since January 1999.
This is a new index, and doesn't have much of a track record in real time, although the data appears to suggest that the recovery has slowed - even stalled - over the last 4 months.
DataQuick: SoCal home sales decline in August
by Calculated Risk on 9/14/2010 02:57:00 PM
From DataQuick: Southern California Home Sales Fall in August; Median Price Dips
Southland home sales fell last month to the lowest level for an August in three years and the second-lowest in 18, the result of a worrisome job market and a lost sense of urgency among home shoppers. ... [sales were] down 2.1 percent from 18,946 sales in July, and down 13.8 percent from 21,502 sales in August 2009.The DataQuick data includes new home sales, but this suggests existing home sales in August were weak nationwide. I'll be looking for the compilation of regional reports from Tom Lawler!
Last month’s sales were the lowest for the month of August since 2007, when 17,755 homes sold, and the second-lowest since August 1992, when 16,379 sold. Last month’s sales were 31.5 percent lower than the August average of 27,070 sales since 1988, when DataQuick’s statistics begin. The average change in sales between July and August is a gain of 3.9 percent ...
“The loss of home buyer tax credits explains much of the sales weakness over the past two months. But other factors are suppressing sales, too, such as the lack of meaningful job growth and potential buyers’ concerns about job security. Also, for many out home shopping now, there’s little beyond ultra-low mortgage rates to pressure them to buy sooner rather than later, especially in areas where the number of homes for sale is climbing,” said John Walsh, MDA DataQuick president.
Goldman: Fed may announce QE2 as soon as November
by Calculated Risk on 9/14/2010 12:53:00 PM
From the WSJ: Goldman: Fed May Announce New Asset Purchases in November
“We don’t expect this at the Sept. 21 meeting, but in November or December there’s certainly a possibility that it will be announced,” Jan Hatzius, chief economist at the bank, said Tuesday. He added the Fed is likely to buy U.S. Treasurys worth around $1.0 trillion to kick-start the economy.I think it will take more evidence of a slowing economy or further disinflation for Fed Chairman Bernanke to persuade other members of the FOMC to embark on QE2.
...
[Goldman] expects the U.S. unemployment rate to creep back up to 10% by early 2011 from 9.6% in August and to stay around that level for most of the year.
Perhaps the unemployment rate ticking up in the September employment report will be enough, but that is the only employment report scheduled to be released before the two day FOMC meeting in November (on Nov 2nd and 3rd). The October employment report will be release on November 5th - two days after the FOMC meeting.
The advance Q3 GDP report (advance estimate) will be released on October 29th, and if that report shows further slowing - that might be enough.
NFIB: Small Businesses slightly less pessimistic
by Calculated Risk on 9/14/2010 10:08:00 AM
From NFIB: Small Business Confidence Remains Low
The National Federation of Independent Business Index of Small Business Optimism gained 0.7 points in August*, rising to 88.8. Most of the improvement was accounted for by gains in expected real sales and expectations for business conditions six months out, the two components that lowered the index in July. But despite their improvements, both measures are still in recession territory.On employment:
“Small business owners are expecting sub-par growth in the second half of 2010,” said Bill Dunkelberg, NFIB’s chief economist.
Average employment growth per firm has been negative since April of 2007 and remained negative for 10 of the 12 following quarterly (first month in each quarter) readings. August brought no improvement, with reported job loss averaging negative 0.3 employees per firm (seasonally adjusted).On capital spending:
The frequency of reported capital outlays over the past six months fell one point to 44 percent of all firms, again hitting the 35-year record low. ... Seventy-three percent of all owners said the current period was NOT a good time to expand.And the key problem:
“What businesses need are customers, giving them a reason to hire and make capital expenditures and then they may have the need to borrow to support those activities,” said Dunkelberg.Note: Small businesses have a large percentage of real estate related companies.
The key problem remains excess capacity - and a lack of customers. There is no reason to invest and hire until business picks up.
Retail Sales increase in August
by Calculated Risk on 9/14/2010 08:30:00 AM
On a monthly basis, retail sales increased 0.4% from July to August (seasonally adjusted, after revisions), and sales were up 3.6% from August 2009. Retail sales increased 0.6% ex-autos. 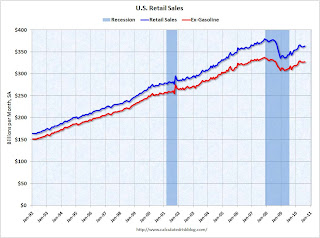 Click on graph for larger image in new window.
This graph shows retail sales since 1992. This is monthly retail sales, seasonally adjusted (total and ex-gasoline).
Retail sales are up 8.4% from the bottom, but still off 4.3% from the pre-recession peak.
Retail sales are still below the April level - and have mostly moved sideways for six months. The second graph shows the year-over-year change in retail sales (ex-gasoline) since 1993.
Retail sales ex-gasoline increased by 3.0% on a YoY basis (3.6% for all retail sales). The year-over-year comparisons were easier earlier this year since retail sales collapsed in late 2008.
Here is the Census Bureau report:
The U.S. Census Bureau announced today that advance estimates of U.S. retail and food services sales for August, adjusted for seasonal variation and holiday and trading-day differences, but not for price changes, were $363.7 billion, an increase of 0.4 percent (±0.5%)* from the previous month, and 3.6 percent (±0.5%) above August 2009. Total sales for the June through August 2010 period were up 4.7 percent (±0.3%) from the same period a year ago. The June to July 2010 percent change was revised from +0.4 percent (±0.5%)* to +0.3 percent (±0.2%).
TARP Deadbeat list grows to more than 120 banks
by Calculated Risk on 9/14/2010 12:01:00 AM
From Brady Dennis at the WaPo: More banks missing TARP dividend payments
The latest report ... shows that more than 120 institutions ... have missed their scheduled quarterly dividend payments ... a record six banks each missed six dividend payments. Saigon National Bank in Southern California has missed seven.
...
In addition, five banks that received capital injections from the controversial $700 billion Troubled Assets Relief Program have failed altogether, making it highly unlikely that taxpayers will recover the nearly $3 billion poured into those institutions.
Monday, September 13, 2010
Capital One CEO: "Very cautious about the housing market"
by Calculated Risk on 9/13/2010 07:15:00 PM
From William Alden at HuffPo: Home Prices Set To Fall Further: Richard Fairbank, Capital One CEO
"I think we feel very cautious about the housing market," [Capital One CEO Richard Fairbank] said. "I think that even despite some of the recent months where home prices have gone up, I think it's a very plausible case for home prices to go back down again."I think house prices started falling again in July, but it might take some time before we see prices falling in the repeat sales index. CoreLogic will probably release their July HPI this week, and that might show declining prices - but that is a weighted average of May, June and July.
...
"We are managing to a view that home prices are more likely to be headed down rather than up."
Investment Contributions to GDP: Leading and Lagging Sectors
by Calculated Risk on 9/13/2010 03:14:00 PM
By request, the following graph is an update to: The Investment Slump in Q2 2009
The following graph shows the rolling 4 quarter contribution to GDP from residential investment, equipment and software, and nonresidential structures. This is important to follow because residential investment tends to lead the economy, equipment and software is generally coincident, and nonresidential structure investment trails the economy.
For the following graph, red is residential, green is equipment and software, and blue is investment in non-residential structures. The usual pattern - both into and out of recessions is - red, green, blue. Click on graph for larger image in new window.
Residential Investment (RI) made a positive contribution to GDP in the Q2 2010, but RI will be a drag on GDP again in Q3.
RI was positively impacted in Q2 by the housing tax credit in two ways: first, builders rushed to complete homes by the end of June, and, second, real estate agent commissions were boosted in Q2 and will decline sharply in Q3 (just look at existing home sales in July).
The rolling four quarter change for RI just turned positive, but will turn negative again in Q3.
Equipment and software investment has made a significant positive contribution to GDP for four straight quarters (it is coincident).
The contribution from nonresidential investment in structures was flat in Q2 - only because of a surge of investment for petroleum and natural gas - while investment in hotels, malls and office buildings continued to decline. As usual nonresidential investment in structures is the last sector to recover.
The key leading sector - residential investment - has lagged the recovery because of the huge overhang of existing inventory. Usually RI is a strong contributor to GDP growth and employment in the early stages of a recovery, but not this time - and this is a key reason why the recovery has been sluggish so far.
On Retail Seasonal Hiring
by Calculated Risk on 9/13/2010 01:04:00 PM
October is the first month for seasonal retail hiring - and most hiring happens in November. So it is probably time to start looking ahead.
According to a survey released last week, most retailers plan on hiring about the same number of seasonal workers as last year (a weak year), however about one-fifth expect to hire more.
Here was an article from the WSJ: Holiday Job Outlook Stays Flat
Most major American retailers plan to hire the same number of temporary holiday workers as last year, according to a survey by a top industry consultant, underscoring that store chains continue to view the coming season with caution.
Still, the annual Hay Group survey ... found that more than one-fifth of respondents expected to hire more seasonal help than in 2009 ...
 Click on graph for larger image.
The first graph shows that seasonally adjusted (blue) and not seasonally adjusted (red) retail employment. There is a clear seasonal pattern (no surprise).
Not only is overall retail employment down, but seasonal hiring was very low in 2008, and still weak in 2009.
 The second graph shows the seasonal hiring by the three key months (October, November and December).
 Although seasonal hiring bounced back last year, it was still the second weakest year since 1989 (only 2008 was worse). From this early survey, it sounds like there should be some increase in seasonal hiring - but it will still be a very weak year.
House Prices and Foreclosures
by Calculated Risk on 9/13/2010 08:48:00 AM
Nick Timiraos has an excellent article on house prices and foreclosures at the WSJ: Banks' Plans for Foreclosed Homes Will Drive Market
The speed at which house prices fall over the next few months could depend ... on how banks decide to manage the huge number of foreclosed homes they own or may take from delinquent borrowers in the near future.Usually house prices are sticky downwards and decline over several years, but the flood of foreclosures in late 2008 pushed down prices significantly in lower priced areas (Tom Lawler called this "destickification").
Unlike home owners, banks often are much quicker to slash prices to unload properties quickly.
...
"We see the perfect storm brewing with rising supply and falling demand," said Ivy Zelman ... She estimated that distressed sales could account for half of the market by year-end if traditional sales didn't rebound.
Something similar could happen again, especially in some mid-to-high end areas where prices are still too high, although it won't be the flood of foreclosures we saw at the end of 2008. But prices will fall.
There is much more in the article ...
Sunday, September 12, 2010
Geithner on Exchange Rate with China
by Calculated Risk on 9/12/2010 11:45:00 PM
From the WSJ: China Has Done ‘Very Little’ on Exchange Rate: Geithner
“China took the very important step in June of signaling that they’re going to let the exchange rate start to reflect market forces. But they’ve done very, very little, they’ve let it move very, very little in the interim."And from Paul Krugman at the NY Times: China, Japan, America
Back in June, Timothy Geithner, the Treasury secretary, praised China’s announcement that it would move to a more flexible exchange rate. Since then, the renminbi has risen a grand total of 1, that’s right, 1 percent against the dollar — with much of the rise taking place in just the past few days, ahead of planned Congressional hearings on the currency issue.Obviously China is a "currency manipulator" ... now what?
Geithner: "Important to avoid premature policy restraint"
by Calculated Risk on 9/12/2010 07:59:00 PM
A few excerpts from a WSJ interview with Treasury Secretary Timothy Geithner: Geithner Urges Action on Economy
"[The] typical error most countries make coming out of a financial crisis is they shift too quickly to premature restraint. ... It is very important for us to avoid that mistake. If the government does nothing going forward, then the impact of policy in Washington will shift from supporting economic growth to hurting economic growth."And on tax cuts for high income earners:
"We just don't think it would be responsible for this country, given the size of our future deficits, and given the substantial burden the middle class has been bearing over the past decade in particular, to go out and borrow $700 billion from our children so we can sustain those Bush tax cuts that only go to the wealthiest 2% of Americans."I agree with Geithner on both points.


