 RSS Feed
 by Calculated Risk on 8/07/2008 02:01:00 PM
Thursday, August 07, 2008
Cartoon: Housing and Gasoline
From Eric G. Lewis, a freelance cartoonist living in Orange County, CA.

Too Much Risk or Too Little?
by Anonymous on 8/07/2008 12:59:00 PM
I strongly recommend this thought-provoking post at naked capitalism by Steve Waldman. Here's part:
One of the more depressing bits of emerging conventional wisdom is the notion that the financial system took on "too much risk" in recent years. I think it is equally accurate to suggest that the financial system took on too little risk.The final stage in the process is not just demands for bailouts but the actual process of criminalizing losses. If you lost money investing in mortgages or housing, it must be because someone defrauded you. In a mania of insufficient risk-taking, the "business judgment rule" becomes inoperative.
Consider the risks that were not taken during the recent credit and "investment" boom. While hundreds of billions of dollars were poured into new suburbs, very little capital was devoted to the alternative energy sector that is suddenly all the rage. Despite a "global savings glut" and record-breaking levels of "investment" in the United States between 2005 and 2007, capital was withdrawn from a variety of industries deemed "uncompetitive" in large part due to obviously unsustainable capital flows. Very few brave capitalists took the risk of mothballing rather than dismantling factories and maintaining critical human capital through the temporary downspike. Under the two to five year time horizon of our most far-sighted managers, whatever is temporarily unprofitable must be permanently destroyed. To gamble on recovery is far too great a risk.
I don't pretend to know where all that capital, that incredible swell of human energy and physical resources, ought to have gone. But it doesn't take an Einstein to know that it probably should not have gone into building Foxboro Court. Sure, hindsight is 20/20. But lack of foresight really wasn't the problem here. In 2005, how many macroeconomists or big-picture thinkers were arguing that the US economy lacked suburban housing stock of sufficient size and luxury? We gave the building boom the benefit of the doubt because it was a "market outcome". But the shape of that outcome was more matter of institutional idiosyncrasies than textbook theories of optimal choice. It resulted as much from people shirking risk as it did from people taking big bets.
The big central banks, whose investment largely drove the credit boom, were (and still are) seeking safety, not risk. The banks and SIVs that bought up "super-senior AAA" tranches of CDOs were looking for safe assets, not risky assets. We had a housing boom, rather than a Pez dispenser bubble, because housing collateral is (well, was) the preferred raw material for fabricating safe paper. Investors were never enthusiastic about cul-de-sacs and McMansions. They wanted safe assets, never mind what backed 'em, and mortgages are what Wall Street knew how to lipstick into safe assets. The housing boom was born less from inordinate risk-taking than from the unwillingness of investors to take and bear considered risks. Agencies, asset-backed securities, it was all just AAA paper. It was "safe", so who cared what it was funding? . . .
We've trained a generation of professionals to forget that investing is precisely the art of taking economic risks, then delivering the goods or eating the losses. The exotica of modern finance is fascinating, and I've nothing against any acronym that you care to name. But until owners of capital stop hiding behind cleverness and diversification and take responsibility for the resources they steward, finance will remain a shell game, a tournament in evading responsibility for poor outcomes.
MIC: General Aviation Business Travel Down
by Calculated Risk on 8/07/2008 12:10:00 PM
Although this is a small company, this is (hopefully) interesting - Macquarie Infrastructure Company reported today (page 7) that they saw a 4% decline in fuel volume sold for general aviation.
On their conference call, Macquarie said they believed this was due to a decline in business travel, and not less vacation travel - since year over year fuel volume was down in most major cities, but not in popular vacation destination spots. (hat tip Brian)
They also commented that private plane owners were shifting to more self park and using valet parking less. Hey, even the better off are feeling the pinch!
Do Existing Home Sales track Pending Home Sales?
by Calculated Risk on 8/07/2008 11:15:00 AM
Several readers have directed me to this CNBC chart comparing Existing Home Sales and Pending Home sales from a June article titled: NAR’s Pending Home Sales: Something’s Amiss

Source: CNBC Reality Check
But here is a longer term graph from the WSJ.
 Source: WSJ Real Time Economics
This shows that existing home sales do track Pending Home Sales pretty well over a longer period.
Note: The WSJ advanced pending home sales one month.
And here is a third graph from Northern Trust:
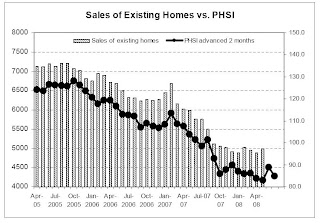 Source: Northern Trust
Note that Northern Trust uses a 2 month lag.
This shows that the choice of scale and time period can impact these types of comparisons. I think the first graph is misleading, and that Existing Homes Sales do track Pending Home Sales pretty well.
Pending Home Sales Rise in June
by Calculated Risk on 8/07/2008 10:02:00 AM
From the NAR: Pending Home Sales Rise
The Pending Home Sales Index, a forward-looking indicator based on contracts signed in June, rose 5.3 percent to 89.0 from a downwardly revised reading of 84.5 in May, but remains 12.3 percent below June 2007 when it stood at 101.4.The pending home sales index has been between 83 and 90 for almost a year. This shows the impact of foreclosure sales - according to the NAR, "short sales and foreclosures [account] for approximately one-third of transactions". This foreclosure activity will probably keep existing home sales (and the pending home sales index) elevated for some time.
Another Version of the Infamous Syron Memo Dust-Up
by Anonymous on 8/07/2008 09:40:00 AM
From the Boston Globe:
The credit warnings reported by the Times came not long after Syron arrived in 2004 to fix Freddie, reeling from an accounting scandal in which executives misstated some $5 billion in earnings. In addition, Freddie's commitment to affordable housing had declined to the point it employed gimmicks to meet congressional goals.This certainly puts matters in a different light. Syron is claiming that when he arrived at Freddie Mac, Freddie was "gaming the system" on affordable housing loans. It was buying pools of these loans, but carrying them only long enough to count them in its year-end affordable housing goals. In the new year, it would sell them back to lenders.
For example, said Syron, Freddie would essentially rent loans to meet affordable housing goals, buying them from lenders to carry on the books at year end, then selling them back. Syron ended that practice and re-emphasized the housing mission.
That put him in conflict with other executives, who believed Freddie's most important duty was to ensure investments were safe and sound. The chief risk officer at the time, David A. Andrukonis, warned Syron the loans Freddie was buying risked the financial position and reputation of the company and the country, the Times reported.
But Freddie had to balance the risks against affordable housing goals, Syron said. Andrukonis and other executives disagreed on that balance, he said. Andrukonis was later fired, Freddie officials said.
"The place didn't have enough orientation towards its housing mission," Syron said, "and he disagreed with that approach." Andrukonis couldn't be reached.
In Syron's version of the story, Andrukonis was advocating that Freddie continue this practice in the name of reducing the risk to Freddie Mac. Syron, on the other hand, felt that Freddie had to take the risk of keeping the affordable housing loans it bought, since that was the whole point of the mandate for the GSEs to buy a certain amount of these loans every year. In this version of events, what Syron was "ignoring" was not the claim that these loans were risky, but the claim that Freddie could avoid this risk just by engaging in "round-trip" transactions that served no economic purpose except fluffing up Freddie Mac's affordable housing goal numbers.
If Syron's version is anywhere near the truth, we have yet more evidence that no good deed ever does go unpunished.
(Thanks, Arnold!)
2007 Vintage: Nowhere to Go?
by Anonymous on 8/07/2008 08:51:00 AM
The Wall Street Journal continues our run of bad news about the 2007 mortgage vintage:
An analysis prepared for The Wall Street Journal by the Federal Deposit Insurance Corp. shows that 0.91% of prime mortgages from 2007 were seriously delinquent after 12 months, meaning they were in foreclosure or at least 90 days past due. The equivalent figure for 2006 prime mortgages was just 0.33% after 12 months. The data reflect delinquencies as of April 30. . . .No doubt all of these factors are in play, even though I'm not yet convinced that they were that much more in evidence in 2007 than in 2006.
Data on other classes of mortgages suggest the same trend. Freddie Mac reported Wednesday that 1.38% of the 2007-vintage loans it purchased were seriously delinquent after 18 months compared with 0.38% of 2006 loans at the same point in their life. Freddie Mac generally purchases loans made to creditworthy borrowers.
Last month, J.P. Morgan Chase & Co. said it expects losses on prime mortgages that weren't securitized and remain on its books to triple from current levels. The increase in bad loans is driven mostly by jumbo mortgages originated in the second half of 2007, a company spokesman said. . . .
Economists and industry officials say several factors may account for the dismal performance of the class of 2007. Home prices were falling sharply in much of the country by 2007, meaning many borrowers who took out loans in that year for nearly the full price of the home now owe more than the home is worth. These borrowers are particularly vulnerable to a weakening economy, and have difficulty selling or refinancing if they lose their job.
Questionable business practices may have played a role, too. Some of the 2007 loans "were knowingly originated as really bad loans," says Chris Mayer, a professor of real estate at Columbia University's business school. Mortgage originators who profited handsomely from the housing boom "realized the game was completely over" and pushed mortgages out the door, says Mr. Mayer.
As credit began to tighten last year, some mortgage brokers and borrowers tried to circumvent tougher restrictions by inflating borrowers' credit scores and appraisal values, says Jay Brinkmann, vice president of research and economics for the Mortgage Bankers Association.
It seems to me that one thing that would help us understand this marked difference in performance between these two vintages is an analysis of the "cure" rate and method of cure of the 2006 vintage delinquent loans, as well as some analysis of the actual loan life (number of months to payment in full) of the higher-risk 2006 loans. I think we need this before we conclude that either the 2007 vintage contained worse loans than 2006 or that house price depreciation itself is an unproblematic "cause" of the elevated early delinquencies in 2007.
What I am saying is that when you compare two vintages like this, you want to know whether the loans in the earlier vintage experienced a lower serious delinquency rate because fewer of those loans were "bad," or because more of those loans had an "exit" short of foreclosure when they went bad. Another way to say this is that we are not simply asking about what origination practices or loan characteristics were at the time of origination of these loans; we are looking at what mortgage market (and RE market) conditions are at the time of first delinquency of these loans.
I am personally not ready to believe, without more data, that inflated FICOs, inflated appraisals, fraudulent income claims, etc. were more prevalent in the 2007 vintage than in 2006. I think it's possible that the marked difference in the early serious delinquency rate is more a function of the choices that a delinquent borrower had in mid-2007 compared to mid-2008. Assuming for the sake of argument that these two vintages were of either comparable quality at origination--or that the 2006 vintage was even worse at origination than 2007--you can still get a higher serious delinquency rate at 18 months for the 2007 vintage just because at 18 months out, 2006 borrowers could still refinance, get a HELOC, or sell their homes when they were still current or only mildly delinquent. No doubt some of those 2006 borrowers refinanced--in 2007, meaning that they just got "revintaged." But the 2007 vintage is hitting its 18-month history right now, when they cannot "escape" into the 2008 vintage or sell or get a HELOC to make first-lien mortgage payments with.
That's just a way of saying that credit tightening will in the nature of things--along with home price drops--increase the serious delinquency rate of a book of mortgages compared to earlier books even if the original credit quality is similar across books. The classic metaphor is "musical chairs."
One thing that was in the Freddie Mac investor slides we didn't look at yesterday was some data on "roll rates" from 2007-2008. I sure wish we had comparable charts from 2006 for comparison purposes. The "roll rate" is the percentage of loans that were in a given status last month and a given status this month. For instance, the "30 to 60" roll rate tells you what percentage of loans that were 30 days delinquent last month became 60 days delinquent this month. You need to bear in mind that a couple of things could have happened to the loans that didn't "roll to 60": they could have become current (the borrower caught up on the missing payment), or stayed at 30 days (the borrower made the next month's payment but never caught up on the missing payment). When you begin to get into the roll rate of serious delinquences, especially 90 to FC, you can also have loans that didn't roll to the next status because of a workout (modification, forbearance, repayment plan).

These roll rates are based on Freddie's total portfolio, not just the 2007 vintage. What they show is that roll rates from 30 to 60 and 60 to 90 increased from January 2007 to June of 2008 for any loan in Freddie's total portfolio in that delinquency category. The 90 to FC roll rate also increased, but seems to have hit a plateau in 2008. I suspect that is because of Freddie's major efforts in the workout department.
But very few if any 30-day or 60-day loans get workouts. Loans that "cure" from a 30-day or 60-day delinquency are almost exclusively a matter of the borrower making up missed payments from his or her own funds, whatever the source of those funds. One possible explanation of the rising roll rates here is that those funds in at least some cases were coming from HELOCs or credit cards until those got maxed out or frozen. Again, that doesn't necessarily mean that the loans that rolled to serious delinquency were "worse" at origination than the loans that cured; it may simply mean that the most recently-originated loans had fewer opportunities to avoid serious delinquency.
Roll rate analysis like this has a major drawback: it doesn't tell you about prepayments. Roll rates are calculated on how many loans you still have on your books today that were in a certain status last month. It is possible to have a rising roll rate but a more stable delinquency rate: the loans you still have on the books get worse (roll to a more serious delinquency at a higher rate), but if at the same time a lot of loans that were mildly delinquent last month paid off this month, your total percentage of seriously delinquent loans can be unchanged or rise at a much slower rate than your roll rate.
We do know that 2006 vintage loans prepaid at a faster rate than 2007 vintage loans. One way of looking at the matter is that you simply have to expect delinquency levels to be higher for 2007 than for 2006 simply due to loan life: the fewer high-risk-at-origination loans in the vintage that refinance (or sell the home) in the first 18 months, the higher the serious delinquency rate will be just because these loans got old enough to go bad.
We have to think about that because we have to understand that the process of credit tightening inevitably forces delinquency rates up. This is the thing that a lot of our politicians just don't get: you cannot "return to sane lending standards" and still prevent the "insane" loans from earlier vintages from ending up in foreclosure. You have to consider the possibility that at least some of the nasty performance of the 2007 vintage is a function of lenders having originated fewer high-risk loans in 2007 than in 2006, not more. It's just that the bad loans they didn't originate in 2007 were things like HELOCs that 2007 borrowers might have used to stave off serious first-lien delinquencies in the first 18 months of their loan lives. Obviously any first-lien loan that basically requires the availability of high-CLTV HELOCs in order to perform for a year and half is not a "good" loan. I'm just not sure that more of that kind of loan was originated in 2007 than 2006. I think it's possible that more of them are getting "flushed out" earlier because of credit tightening in 2008 is putting a stop to their ability to limp along as earlier vintages did.
Wednesday, August 06, 2008
New York Commercial Rental Rates Decline
by Calculated Risk on 8/06/2008 09:32:00 PM
From the NY Sun: Commercial Rental Rates Plummet in Manhattan
The slowdown in the real estate market is finally hitting New York office space ... Asking rent declined 2.2%, to $69.29 a square foot, while Class A rents plummeted 4.4%, to $90.65, according to Studley's second-quarter market report ...Sublease space really hurt the NY commercial market in the previous downturn, and it appears to be happening again.
Meanwhile, the availability rate jumped half of a percentage point, to 8.2% — nearly a full percentage point higher than a year ago. ... the supply of sublet space is increasing, up 34% versus the prior quarter, to 8.3 million square feet.
And all those CMBS - with the assumed yearly rent increases - are about to discover what happens when vacancy rates rise and rents decline.
 Click on graph for larger image in new window.
Most of the CMBX indices are near new record lows again.
Note: Up is down for the CMBX indices. The CMBX is quoted as spreads, whereas ABX is quoted as bond prices. When the spreads increase - chart going up - the bond prices are going down.
This graph is the CMBX-NA-BB-4 close today.
AIG:$5.36 Billion Loss
by Calculated Risk on 8/06/2008 06:25:00 PM
From Bloomberg: AIG Posts Third Straight Quarterly Loss on Housing
American International Group ... posted a $5.36 billion loss as writedowns tied to the housing slump wiped out profit for a third straight quarter. ...The confessional is still very busy.
The insurer reduced the value of credit-default swaps, guarantees AIG sold to protect fixed-income investors, by $5.56 billion and marked down other holdings by $6.08 billion before taxes.
...
The biggest insurers in the U.S. and Bermuda posted more than $77 billion in writedowns linked to the collapse of the mortgage market from the start of 2007 through the first quarter, with AIG representing about half that total.
AmeriCredit: Auto Loan Originations Down Sharply
by Calculated Risk on 8/06/2008 05:31:00 PM
From auto lender AmeriCredit: AmeriCredit Reports Fourth Quarter and Fiscal Year 2008 Operating Results
AmeriCredit today announced a net loss of $150 million ...Wow. Originations were off almost 70% compared to the same quarter last year. Talk about less lending.
The allowance for loan losses as a percentage of receivables increased to 6.3% at June 30, 2008, from 5.7% at March 31, 2008.
...
Originations were $780 million for the quarter ended June 30, 2008, compared to $2.51 billion for the same quarter last year.
...
"We have taken proactive steps to conserve liquidity and position the business to withstand the weak macroeconomic environment and the dislocation in the capital markets," said AmeriCredit President and Chief Executive Officer Dan Berce.
Fannie and Freddie: High LTV, Low FICO by Year
by Calculated Risk on 8/06/2008 04:03:00 PM
UPDATE: Newer table showing round trip on lending standards.
Brian has sent me this table (from UBS) summarizing the percentage of high LTV (loan to value), and low FICO loans made by Fannie and Freddie each year. Click on table for larger image in new window.
UBS commented:
"We expect the delinquencies to rise considerably further, given the deterioration of the GSE book of business in 2007. As the non-Agency markets shut down in 2007, conforming product that had risk layering came into Agency space.
...
No matter what box one looks at, the results are the same - in the first 8 months of 2007, the % of Freddie and Fannie issuance with risky characteristics rose considerably. ... It is well documented that increased risk layering causes losses to multiply."
Pimco's Gross: Treasury to Buy Fannie/Freddie Preferred by End of Quarter
by Calculated Risk on 8/06/2008 03:43:00 PM
From Bloomberg: Pimco's Gross Says U.S. Will Rescue Fannie, Freddie (hat tip Yal)
``By the end of the third quarter, the preferred stock in Fannie and Freddie will be issued, the Treasury will have bought it,'' Gross, co-chief investment officer at Pacific Investment Management Co., said today in an interview on Bloomberg Television. ``We'll be on our way toward a joint Treasury-agency combination.''This will probably happen the first week of September since I'll be on a hiking trip! No worries - Tanta and friends will have it covered.
...
The government will probably buy $10 billion to $30 billion of preferred stock, Gross said.
Restaurant Performance Index Shows Contraction
by Calculated Risk on 8/06/2008 01:21:00 PM
Here is another index to track; the Restaurant Performance Index from the National Restaurant Association (NRA). (hat tip Lyle)
From the NRA: Restaurant Performance Index Declined in June as Same-Store Sales and Customer Traffic Slipped
"The June decline in the Restaurant Performance Index was the result of a drop in the current situation component," said Hudson Riehle, senior vice president of research and information services for the Association. "Restaurant operators reported negative same-store sales and customer traffic levels in June, after posting somewhat stronger results in May."
"The uncertain economy and rising food costs continue to create a challenging business environment for restaurant operators," Riehle added. "A record 29 percent of restaurant operators said the economy is the number-one challenge facing their business, while 22 percent identified food costs as their top challenge."
 Click on graph for larger image in new window.
Unfortunately the data for this index only goes back to 2002.
The index values above 100 indicate a period of expansion; index values below 100 indicate a period of contraction.
Based on this indicator, the restaurant industry has been contracting since mid-year 2007.
Freddie: Alt-A and Default by Year
by Calculated Risk on 8/06/2008 12:18:00 PM
On Alt-A from Brian:
[Freddie has] $190B of Alt-A in the guarantee portfolio, $93B of which is in their 7 high DQ states (CA, FL, AZ, VA, NV, GA, MI, MD), and $115 of which is 06/07 vintage. 29% have current LTV>90% and 17% have current LTV >100% (chart 27 has a matrix of different cuts at the guarantee portfolio - there are quite a few high risk loan categories where the % of loans with current LTV>100% is in the range of 15-30% of the portfolio - with more to come as house prices decline further - chart 28 is worth a look too - there is going to be a lot of loss content in some of the cells on that matrix)
90+ day DQ's on their Alt-A book increased from 2.32% in Q1 to 3.72% in Q2!
They have $82B of uninsured 1st Lien subprime ABS, $65B of which is 06/07 vintage. The have $21B of ALT-A ABS.
On the credit enhancement question from before, for their guarantee portfolio as a whole, 18% has credit enhancement, but 92% of the loans with >90% LTV have enhancement, but only 16% of the Alt-A have it, only 14% of the IO loans have it, and 13% of option ARMs have it.
 Click on graph for larger image in new window.
This graph from the Freddie investor's slides shows the default rates of Alt-As vs. the rest of the portfolio.
As we've been discussing, the 2nd wave of defaults it just starting, and Alt-A will be ground zero this time.
The second graph shows delinquencies by year, and shows the impact of the credit crunch.
 From Brian:
 Finally, Chart 32 is a great graphical depiction of moral hazard in action. It shows delinquencies by book year and 2006 is looking very good, but 2007 (on a relative basis) is off the charts because they caved to political pressure and took on all those crappy loans when the private label MBS market shut down.
Freddie Conference Call Notes
by Calculated Risk on 8/06/2008 11:18:00 AM
A few notes from the Freddie Mac conference call (hat tip Brian):
They are now expecting nation HPD (home price depreciation) of 18-20% vs prior assumption of 15% (using their national index). They think we are halfway through the price decline.
Severity assumptions in loan loss provision increased from 22% in Q1 (ending March) to 26% in Q2 (ending June).
Until their credit raising options clarify, they will approach growth of their mortgage portfolio cautiously. They acknowledged that the market realizes that it will be difficult for them to grow and that has probably contributed to increase in mortgage spreads. Their base case forecast is that their portfolio has no growth.
They have a chart of the credit profile of their guarantees at various points over the last year or so (chart 13 in the slide deck) that is worth a look. The worst quintile of loans (from a credit characteristics standpoint) from the 2007 peak had the following characteristics (they don’t say when the peak is, but my guess is that it would be late Q2 or early Q3):
 Click on table for larger image in new window.
Their “expected default costs” on this bucket of guarantees is 97bp – it does not detail how that number is calculated, but I can’t imagine how it would be that low if its similar to a realized loss number on that portfolio (don’t know what if any PMI is on that group).
Freddie Mac: $821 million in Losses, Cuts Dividend
by Calculated Risk on 8/06/2008 09:24:00 AM
From MarketWatch: Freddie Mac loses $821 million on housing, credit markets
Freddie Mac, the second-biggest U.S. buyer of mortgages, reported Wednesday a second-quarter loss of $821 million ... [Freddie] is planning to slash its dividend to five cents a share or less for the third quarter, down from a previous payout of 25 cents a share.Here is the Bloomberg story: Freddie Mac Posts Fourth Straight Loss, Cuts Dividend
...
Freddie said provisions for credit losses in the June quarter were $2.5 billion, wider than the $1.2 billion for the first three months of 2008, reflecting increases in delinquency rates, foreclosures and the estimated severity of losses driven by the continued fall in home prices.
And from the WSJ: Freddie Swings to Loss
Tuesday, August 05, 2008
FirstFed and Option ARMs
by Calculated Risk on 8/05/2008 10:32:00 PM
From the WSJ: FirstFed Grapples With Fallout From Payment Option Mortgages
Like many mortgage lenders, FirstFed Financial Corp. is struggling with rising losses. ... Forty percent of its borrowers became at least 30 days delinquent after the payments on their adjustable-rate mortgages were recast. The number of foreclosed homes held by the bank doubled in the second quarter from the first quarter.It seems like Tanta and I have been writing about the coming wave of Option ARM defaults forever, but it's only been since 2005!
But FirstFed isn't another bank grappling with the fallout from subprime mortgages that went to less-creditworthy borrowers. ... [T]he Los Angeles bank is on the front lines of what could be the next big mortgage debacle: payment option mortgages.
Barclays Capital estimates that as many as 45% of option ARMs, as they are often called, originated in 2006 and 2007 could wind up in default. Another analysis, by UBS AG, suggests that defaults on option ARMs originated in 2006 could be as high as 48%, slightly higher than its estimate for defaults on subprime loans.The key here, for the housing market, is that the next wave of defaults will be hitting middle to upper middle class neighborhoods.
We're all subprime now! (a classic Tanta phrase)
The Slowdown in China
by Calculated Risk on 8/05/2008 06:50:00 PM
Note: Please don't miss Tanta's post this morning on the NY Times and Freddie Mac.
On China and trade: This first graph shows the combined loaded inbound and outbound traffic at the ports of Long Beach and Los Angeles in TEUs (TEUs: 20-foot equivalent units or 20-foot-long cargo container). Although containers tell us nothing about value, container traffic does give us an idea of the volume of goods being exported and imported. Click on graph for larger image in new window.
Inbound traffic grew quickly for a number of years, but appears to be declining (there is a strong seasonal component). Inbound traffic is off almost 14% from June 2007.
Outbound traffic was flat for years, but has been increasing the last few years. Outbound traffic is up 12% from June 2007.
A few key points: Imports have slowed, and U.S. exports are increasing fairly rapidly. This means the trade deficit (especially ex-petroleum) is also decreasing. This change in the trade balance is probably due to the weak dollar and the weak U.S. economy.
Trade has also boosted GDP (trade contributed 2.4% to the Q2 GDP growth), and has kept U.S. manufacturing employment from falling sharply as usually happens in a recession. This last point has been important in my forecast that headline unemployment wouldn't reach 8% in this cycle.
And from the NY Times: Booming China Suddenly Worries That a Slowdown Is Taking Hold
China's post-Olympics economic slowdown has started before the Games have even begun.
New orders at Chinese factories plunged last month. Exports are barely growing, after adjusting for inflation and currency fluctuations. The real estate market is weakening, with apartment prices sinking in southeastern China, the region hardest hit by economic troubles.
"China has slowed down a lot already, but it's going to slow down more," said Hong Liang, the senior China economist at Goldman Sachs.
...
Weak demand from the United States over the past year, and now from Europe as well, is part of China's emerging problem. On Sunday evening, the port here in Hong Kong was less full of containers than usual, part of a broader slowing of export growth.
 This slowdown is reflected in the Shanghai SSE composite index that is off about 54% from the peak.
And this slowdown is probably impacting oil prices. And that will also help the U.S. trade deficit.
The danger is that China - and the rest of the global economy - will slow down too quickly, and U.S. exports will be negatively impacted. That could lead to more unemployment in the U.S. than I'm currently forecasting, and also a deeper recession.
Morgan Stanley Freezes Some HELOCs
by Calculated Risk on 8/05/2008 05:53:00 PM
From Bloomberg: Morgan Stanley Said to Freeze Client Home-Equity Credit Lines (hat tip Brian)
Morgan Stanley ... told several thousand clients this week that they won't be allowed to withdraw money on their home- equity credit lines ...A home equity line of credit implies the borrower has some home equity left. Morgan Stanley is just the latest lender to freeze HELOCs for clients with insufficient home equity due to falling property values.
``Consistent with the terms of the HELOC, or home-equity line of credit, Morgan Stanley periodically reassesses client property values and risk profiles,'' said Christine Pollak, a Morgan Stanley spokeswoman in New York. ``A segment of clients was recently notified of a change in the status of their home equity line of credit or HELOC due to a change in the value of their property and/or their credit profile.''
Q2 Office, Hotel and Mall Investment
by Calculated Risk on 8/05/2008 03:18:00 PM
A couple more graphs based on the underlying details for the Q2 GDP report.
Based on tighter lending standards, rising vacancy rates (lower occupancy rate for hotels), and the Architectural Billing index, it appears there will be a sharp slowdown in investment in offices, malls and hotels in the 2nd half of 2008.
However, as of Q2 2008, only mall investment is declining - in fact, investment in lodging soared in Q2! Click on graph for larger image in new window.
Investment in multimerchandise shopping structures (malls) declined slightly in Q2 2008, after peaking in Q4 2007.
Investment in lodging soared in Q2 to $46.1 billion (SAAR) from $40.4 billion (SAAR) in Q1. This is probably due to builders rushing to finish projects.
This investment in lodging will probably decline sharply in the 2nd half of '08 as builders cancel or postpone projects. As an example, from CNNMoney: Boyd Gaming suspends Vegas casino-resort project (hat tip Erik)
[C]asino operator Boyd Gaming Corp. announced Friday that it will stop work for nine months to a year on a $4.8 billion mega development.
The Echelon [includes] nearly 5,000 guest rooms in five hotels ...
 The second graph shows office investment as a percent of GDP since 1972.
NOTE: In 1997, the Bureau of Economic Analysis changed the office category. In the earlier years, offices included medical offices. After '97, medical offices were not included (The BEA presented the data both ways in '97).
This shows the huge over investment in offices in the '80s due to the S&L lending. This graph also shows the office building boom associated with the stock market bubble. The office bubble is smaller this time, but I expect investment to decline for all three categories - offices, lodging and malls - in the 2nd half of 2008.


