 RSS Feed
 by Calculated Risk on 9/27/2007 11:03:00 AM
Thursday, September 27, 2007
More on August New Home Sales
For more graphs, please see my earlier post: August New Home Sales Click on graph for larger image.
The first graph shows New Home Sales vs. Recession for the last 35 years. New Home sales were falling prior to every recession, with the exception of the business investment led recession of 2001. This should raise concerns about a possible consumer led recession - possibly starting right now!
The second graph compares annual New Home Sales vs. Not Seasonally Adjusted (NSA) New Home Sales through August.
Typically, for an average year, about 70% of all new home sales happen before the end of August. Therefore the scale on the right is set to 70% of the left scale.
It now looks like New Home sales will be in the low 800s - the lowest level since 1997 (805K in '97). My forecast was for 830 to 850 thousand units in 2007 and that might be a little too high.
A comment on revisions:
The Census Bureau revises the New Home sales number three times (plus annual revisions). During a housing down turn, most of the revisions from the Census Bureau are down. This is important to keep in mind when looking at a new monthly report. This chart shows the cumulative revisions for each month since sales activity peaked in July 2005 (annual revisions are not shown). The last time there was a positive cumulative revision (red column) was in September 2005.
The median change for the first revision is a decline of 1.6% (average decline of 1.8%) over the last two years.
The cumulative median change for the second revision is a decline of 3.6%.
The cumulative median change for the third revision is a decline of 4.8%. Since the last upward cumulative revision (Sept 2005), the range has been from a small decline of 0.2% in Dec '05, to a decline of almost 11% for May '06.
The new homes sales number today will probably be revised down too. Applying the median cumulative revision (4.8%) during this downtrend suggests a final revised Seasonally Adjusted Annual Rate (SAAR) sales number of 757 thousand for August (was reported as 795 thousand SAAR by the Census Bureau). Just something to remember when looking at the data.
August New Home Sales
by Calculated Risk on 9/27/2007 09:59:00 AM
According to the Census Bureau report, New Home Sales in August were at a seasonally adjusted annual rate of 795 thousand. Sales for July were revised down to 867 thousand, from 870 thousand. Numbers for May and June were also revised down. 
Click on Graph for larger image.
Sales of new one-family houses in August 2007 were at a seasonally adjusted annual rate of 795,000 ... This is 8.3 percent below the revised July rate of 867,000 and is 21.2 percent below the August 2006 estimate of 1,009,000.
The Not Seasonally Adjusted monthly rate was 68,000 New Homes sold. There were 88,000 New Homes sold in August 2006.
Aug '07 sales were the lowest August since 1995 (63,000).
The median and average sales prices were down sharply. Caution should be used when analyzing monthly price changes since prices are heavily revised and do not include builder incentives.
The median sales price of new houses sold in August 2007 was $225,700; the average sales price was $292,000.
The seasonally adjusted estimate of new houses for sale at the end of August was 529,000.
The 529,000 units of inventory is slightly below the levels of the last year.
Inventory numbers from the Census Bureau do not include cancellations - and cancellations are once again at record levels. Actual New Home inventories are probably much higher than reported - some estimate are about 20% higher.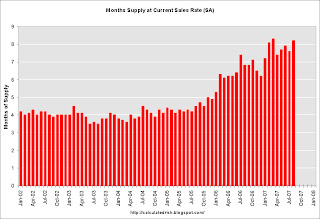
This represents a supply of 8.2 months at the current sales rate.
This is another very weak report for New Home sales. This is the first report after the start of the credit turmoil, and, as expected, the numbers are very ugly.
More later today on New Home Sales.
Who Should Pay the Rating Agencies?
by Anonymous on 9/27/2007 09:48:00 AM
From the International Herald Tribune, we see that Congress is getting up on its hind legs and barking over the perennial issue of who pays for bond ratings:
Democratic and Republican senators said they were particularly concerned with one aspect of the agencies' business models: They get paid by the companies whose bonds they rate. That is like a film production company paying a critic to review a movie, and then using that review in its advertising, said Senator Jim Bunning, Republican of Kentucky.Right. Because we all know that film critics' salaries are paid by surcharges on movie tickets, not newspaper advertising revenue. Whatever.
I really do want to know why those who believe that rating agency fees should be paid by investors, not issuers, believe that this is going to improve anything. I'm not defending the status quo; I'm legitimately curious. There's no context we can imagine in which, say, large institutional investors who pay the lion's share of those fees might not put pressure on the RAs to keep them from downgrading an outstanding issue, against which the investor doesn't really want to hold more reserves or capital? There are no transparency concerns when only those "accredited investors" who pay subscription fees can see rating benchmarks? (It's working so well for the hedge fund industry . . .) Issuers would somehow become unable to pressure the agencies for the "right" rating if they didn't directly pay those invoices? You know a clear, bright-line distinction between "issuers" and "investors" you could share with me? If Bear Stearns, say, buys tranches for its own trading account, and also issues them off its own shelf, what difference does it make which cost center cuts the checks to Moodys?
Let's contrast this situation with the highly satisfactory smooth working of consumer credit reports. The information in those reports is provided by creditors, not the individuals who are subject to them. The fee for use of that information is paid by subscribers--creditors, mostly--although they turn around and pass that cost onto applicants and borrowers. You pay the cost of lenders getting your credit report from a for-profit company who considers its information on you to be its property, not yours. In an environment of rampant identity theft and privacy violation--an environment caused, basically, by the existence of electronic repositories of sensitive data that consumers don't profit from, although they take the incalculable privacy risk--there can be no "transparency" of FICOs, and you wouldn't want there to be.
However, in an attempt to fight back, a whole industry of manipulating consumer credit ratings has sprung up, driven by both consumers wanting more or cheaper credit and lenders wanting more or more profitable borrowers. In all of this, the mortgage industry in particular is reeling from the results of its overreliance on FICOs, which were designed more for evaluating the risk of unsecured lending than mortgage lending, and that can rather easily be used to find not the most credit-worthy borrowers but the most profitable ones: those who do not default, but who run up balances sufficiently and pay enough periodic late fees to be a credit card issuer's dream come true. As more people are granted more unsecured credit by savy users of FICOs, the FICOs themselves "improve" for a class of borrowers who now want mortgage loans based on those FICOs.
Some of you may not know this, but there used to be a chronic problem with subprime mortgage servicers refusing to report data to the credit repositories. That meant that those borrowers who got a subprime loan and then paid it on time were not benefitting, since their credit record didn't show the on-time payments; when they went to refinance, they got put into another subprime loan. You would also find subprime servicers not reporting current balances, only original ones, making these borrowers look more indebted than they really were. It took Fannie and Freddie coming out with the declaration that they would no longer buy loans from seller/servicers who did not "full file report" to the credit bureaus to put a stop to this practice. Anyone who is convinced that users of ratings always have an interest in the accuracy of ratings should ponder this: there's always money to be made off of information asymmetry. It's fashionable these days to see bond investors as the hapless innocent victims of issuers and their lapdog rating agencies, but I'm old enough to have seen lenders who foot the bill for consumer credit reports going out of their way to make sure those reports didn't tell the whole picture.
I really want to know why we think subscriber-paid fees in the bond rating world is going to result in something we'll be happy with.
Thursday Close Harmony Blogging
by Anonymous on 9/27/2007 07:06:00 AM
I know, it's not Saturday yet, but CR's little caption contest below was just too tempting.
Wednesday, September 26, 2007
LA Times Photo Caption Contest
by Calculated Risk on 9/26/2007 09:06:00 PM
From the LA Times:

News item: "For 10 days now, a sagging house parked on the Hollywood Freeway's northbound shoulder in the Cahuenga Pass has had people gawking -- and talking."Some of the captions are great. My favorites:
"If you lived here, you'd be home now!"
Gary
"Halfway to Calabasas, Bob realizes his mistake and decides to mail in the keys instead."
Raughle
Subprime-Mortgage Defaults Increase
by Calculated Risk on 9/26/2007 08:50:00 PM
From Bloomberg: Subprime-Mortgage Defaults Rose Last Month, Data Show (hat tip John & Jim)
Late payments and defaults among subprime mortgages packaged into bonds rose last month ...
After August payments, 19.1 percent of loan balances in 20 deals from the second half of 2005 were at least 60 days late, in foreclosure, subject to borrower bankruptcy or backed by seized property, up from 17.5 percent a month earlier, according to a report yesterday from Wachovia Corp.
Prepayment speeds for the loans slowed, suggesting it's more difficult for borrowers to sell their homes or refinance, according to another report by New York-based analysts at UBS AG. Record levels of delinquencies and defaults on subprime mortgages are worsening as home prices decline and interest rates on loans adjust higher for the first time. As lenders tighten standards, borrowers are finding it harder to refinance into new mortgages with lower payments.
The ``reports showed the first inkling of the impact of shutdown of subprime market,'' the UBS analysts led by Thomas Zimmerman wrote late yesterday. ``In our opinion, the full impact is yet to come.''
Sallie Mae Deal in Trouble
by Calculated Risk on 9/26/2007 04:58:00 PM
From MarketWatch: Sallie Mae says deal to buy lender threatened
The group of investors that agreed to buy SLM Corp. has said that it can't close the deal under the agreed-upon terms, the giant student lender announced Wednesday.The NY Times had an article on the Sallie Mae deal last week: Deal to Buy Sallie Mae in Jeopardy
SLM, commonly known as Sallie Mae said that the group "has no contractual basis to repudiate its obligations" under the agreement, and pledged to pursue "all remedies available" to get the deal done.
While the group is hoping to renegotiate the price of Sallie Mae, these people said, it may also be willing to walk away and pay the $900 million breakup fee.The $900 million breakup fee is a little higher than the reported percentage writedowns at Lehman and Morgan Stanley. The total deal value is $25 Billion.
Graphing Housing Prices
by Calculated Risk on 9/26/2007 01:07:00 PM
My apologies to Tanta, this is my version of an UberNerd post: How to graph housing prices.
The NY Times included a graph of real house prices based on the Case-Shiller index in the following article: They Cried Wolf. They Were Right.

Click on graph for larger image in new window.
The graph has several interesting events annotated, including when economist Dean Baker sold his condo in May 2004, and Fed Chairman Ben Bernanke's comment in Feb 2006 that Fed policy makers "expect the market to cool but not to change very sharply".
Unfortunately I think this graph is somewhat misleading and technically incorrect. So I'd like to use this graph to illustrate how to graph housing prices.
This graph is based on the quarterly S&P/Case-Shiller® U.S. National Home Price Values. The S&P/Case-Shiller® index is for nominal house price (not adjusted for inflation).
To adjust for inflation, the NY Times used the CPI from the BLS. This is a slight technical error; an economist would adjust the Case-Shiller index using "CPI less shelter". Admittedly the differences are minor.
Setting Q1 1987 to 100, the NY Times calculated prices fell to 92 in Q4 1996. Using CPI less Shelter, prices would have only fallen to 93 (minor difference).
However, the NY Times calculated prices peaked at 171 in Q1 2006. Using CPI less Shelter, the peak was actually 176, about a 3% difference.
The other problem with the NY Times graph is the choice of scale without warning the reader. IMO the starting value for the y-axis should be clear. This graph is fine if the reader understands that the graph shows the changes in real values, but not the relative absolute values.
 Click on graph for larger image.
The second graph shows the same data with the scale starting at zero (the blue line is the NY Times calculation of real values, the shaded area is the technically correct calculation).
But even this graph could mislead the reader. Will prices return to 100 (the Q1 1987 price)? Unlikely. First, 1987 was chosen because that is one the Case-Shiller index starts. We do not know from this chart if prices in 1987 were too high, too low, or just about right.
Second, real prices for houses do increase over time - perhaps on the order of 1% to 2% per year. Using 1987 as a starting point, a 2% real return would have put current real prices at 150; a 1% annual return would put the current value at 122.
What people really want to know is what will happen to nominal prices in the future. But the focus on real prices helps predict changes in future nominal prices. I'll have more on this later.
Modification Update
by Anonymous on 9/26/2007 11:19:00 AM
Many of our commenters have expressed concern over the possibility that servicers offering workout modifications will lead to "freeloading" by borrowers who could make their payment, but who wish to tell the servicer a sob story and get a rate break. I thought you might find the following from American Banker (subscription only) interesting:
In an interview this month, J.K. Huey, the senior vice president of home loan servicing at IndyMac Bancorp Inc., said that more than half of the borrowers who call the company for a workout or a loan modification do not qualify.The gist of the article is that modification rates are still very low relative to the number of troubled borrowers; Moodys estimates that about 1.00% of 2005-vintage ARMs have been modified this year.
"We want to help people stay in their home provided they have the financial ability to do so," she said. "But we have to make sure they're going to be successful and the loan is going to perform. We can't do a modification just for the sake of it."
Of those whose requests for relief are rejected, roughly 60% did not respond to written requests for financial information, such as the borrower's last two pay stubs, a W-2 form or the last income tax return. "A lot of people do not want to send the financial information needed to prove what their income is," Ms. Huey said. "They really don't want to take the time to work with us."
The other 40% of loans that are denied loss mitigation are to borrowers who are current on their mortgage payments but who contacted IndyMac in an effort to get a lower rate, she said.
"We do have some customers calling us that shouldn't be calling us," Ms. Huey said. After reviewing those customers' finances, "we say that they have a $4,000 surplus and are able to make their payments, and they say they just wanted to check."
For those interested in data sources, the article quotes a spokesman for First American Title indicating that requests for modification-related title updates are up about 40%. (A modification does not require a new title insurance policy, as a refinance does, but it does need a "date-down" endorsement to bring the mortgage date down to the modification date, which is much cheaper than a new refi policy.) So title update volume might be a useful proxy for modification activity outside the securitized sector (which a source like the investment banks or rating agencies will limit themselves to).
ARM Pain: Updated BofA Reset Chart
by Calculated Risk on 9/26/2007 10:26:00 AM
Mathew Padilla at the O.C. Register has an updated ARM reset chart from Bank of America analyst Robert Lacoursiere.
See Mathew's blog for more discussion and a comparison to the previous chart.
Some readers have noted that the BofA numbers are higher than the Credit Suisse and UBS reset numbers. CS and UBS are apparently only looking at securitized loans, and BofA includes unsecuritized loans.
Also, CS and UBS apparently only include the first reset when the loan goes from "fixed to floating". Perhaps BofA includes subsequent resets too, double counting some loans.
LIBOR or SLIMBOR?
by Anonymous on 9/26/2007 08:27:00 AM
Well, you know what's in your cornflakes--I hope. Do you know what's in your ARM index? According to the Financial Times, the London Interbank Offered Rate may well mean Selected London Inter-Marginal Bank Offered Rate:
“The Libor rates are a bit of a fiction. The number on the screen doesn’t always match what we see now,” complains the treasurer of one of the largest City banks.Almost all subprime ARMs, the vast majority of Alt-A ARMs, and a significant chunk of prime ARMs are indexed to 6- or 12-month (dollar-denominated) LIBOR in the U.S. (I'm still looking for a source of exact figures.) One of the ways LIBOR was "sold" to consumers who were used to old-fashioned indices like Constant Maturity Treasury (CMT) or Cost of Funds (COFI) was that it "lagged" these U.S.-centric indices on the upside, implying that LIBOR ARM rates would not rise as quickly. That was mostly nonsense then, and it may be pretty painful nonsense now if the interbank borrowing practices on which LIBOR is based shift such that it becomes a "penalty rate" for bank borrowing.
Such criticism is, unsurprisingly, rebuffed by those who compile the index each day. However, it highlights two other trends that have emerged in the money markets in recent weeks.
One of these is a growing divergence in the rates that different banks have been quoting to borrow and lend money between themselves.
For although the banks used to move in a pack, quoting rates that were almost identical, this pattern broke down a couple of months ago – and by the middle of this month the gap between these quotes had sometimes risen to almost 10 basis points for three month sterling funds.
Moreover, this pattern is not confined to the dollar market alone: in the yen, euro and sterling markets a similar dispersion has emerged. However, the second, more pernicious trend is that as banks have hoarded liquidity this summer, some have been refusing to conduct trades at all at the official, “posted” rates, even when these rates have been displayed on Reuters.
“The screen will say one thing but people are actually quoting a different level, if they are quoting at all,” says one senior banker.
Some observers think this is just a short-term reaction to the current crisis. However, it may also reflect a longer-term shift. This is because one key, albeit largely unnoticed, feature of the banking world in recent years is that many large banks have reduced their reliance on the interbank market by tapping cash-rich companies and pensions funds for finance instead.
The recent crisis appears to have accelerated this trend. In particular, it appears that some large banks have in effect been abandoning the interbank sector in recent weeks, turning to corporate or pension clients for funding by using innovative repurchase agreements.
This trend is bad news for smaller institutions, such as British mortgage lenders, because these, unlike large banks, generally do not have any alternative ways of raising funds outside the interbank world.
Prediction: If we "innovate" back to Treasury-based ARM indices (by pulling those dusty old CMT notes out of the drawer), it will be sold to you all on the basis that CMT is a "lagging" index.
Tuesday, September 25, 2007
Shiller Sees `Years of Decline' for U.S. Housing
by Calculated Risk on 9/25/2007 05:57:00 PM
On Bloomberg Video: Shiller of Yale Sees `Years of Decline' for U.S. Housing.
Click image for video.

September 25 (Bloomberg) -- Robert Shiller, chief economist at MacroMarkets LLC and a professor at Yale University, talks with Bloomberg's Kathleen Hayes from New Haven, Connecticut, about the state of the U.S. housing market, the outlook for home prices and the likelihood of a recession. Home prices in 20 U.S. metropolitan areas fell the most on record in July, indicating the threat to consumer spending was rising even before credit markets seized up in August, according to the S&P/Case-Shiller home-price index. (Source: Bloomberg)And check out the video on the Miami condo auction at the bottom of the posts.
More on August Existing Home Sales
by Calculated Risk on 9/25/2007 05:18:00 PM
For more existing home sales graphs, please see the previous post: August Existing Home Sales
Here are a few more graphs on inventory and months of supply. Click on graph for larger image.
The first graph shows the monthly inventory levels for the last four years. There is somewhat of a seasonal pattern, with inventory peaking in the summer months.
This wasn't true in 2005 - as inventory continued to increase throughout the year - and that was one of the indicators that the housing boom had ended.
For 2007, I expect that inventory levels are close to the peak level.
The second graph shows the monthly 'months of supply' metric for the last four years.
Even if inventory levels stabilize, the months of supply could continue to rise - and possibly rise significantly - if sales continue to decline.
To put the NAR numbers into perspective, here are the year-end sales, inventory and months of supply numbers, since 1969. This graph shows the actual annual sales, year end inventory and months of supply, since 1982 (sales since 1969). For 2007, the August inventory and Seasonally Adjusted Annual Rate (SAAR) for sales were used.
The current inventory of 4.581 million is the all time record. The "months of supply" metric is 10.0 months. The "months of supply" is now above the level of the previous housing slump in the early '90s, but still below the worst levels of the housing bust in the early '80s.
Both the numerator and the denominator are moving in the wrong direction. Not only is inventory at record levels, but sales - though falling - are still significantly above the normal range as a percent of owner occupied units.
Forecasts
The following graph shows the actual cumulative existing home sales (through August) vs. three annual forecasts for 2007 made at the beginning of the year (NAR's Lereah, Fannie Mae's Berson, and me).  My forecast was for sales to be between 5.6 and 5.8 million units (shown as 5.7 million).
NSA sales are 4.074 million units through August. In a typical year, sales through August are about 69% of the sales for the year. So at the current pace, sales will be around 5.9 million. However sales have slowed, and will probably slow further in the months ahead.
To reach the NAR forecast, revised downward again on Sept 11th to 5.92 million units, sales would have to be at the 2006 levels for the remainder of the year. Given tighter lending standards, we can probably already say that even the September NAR forecast was too optimistic.
Undercapitalized Bond Insurers?
by Anonymous on 9/25/2007 02:49:00 PM
This is unpleasant news (from Bloomberg):
Sept. 25 (Bloomberg) -- Bond insurers, including those owned by AMBAC Financial Group Inc. and FGIC Corp., may need to raise capital to maintain their top credit ratings if losses worsen on subprime mortgage securities, Moody's Investors Service said.And this is a curious turn of phrase:
Under what Moody's called its most stressful scenario, losses on securities backed by subprime mortgages could reach 14 percent, causing AMBAC, FGIC, Security Capital Assurance Ltd. and CIFG Assurance North America Inc. to fall short of the capital needed to keep their Aaa ratings. The most likely source of losses would be from guarantees on collateralized debt obligations, which may be backed by subprime mortgage securities. The stress test is higher than Moody's expected loss rate of 10 percent under which the guarantors experience no material losses.
``Because ratings are so important to the industry's value proposition, the rating agency believes that a highly rated financial-guarantor with a strong ongoing franchise would likely take whatever action is feasible to preserve its rating during times of stress,'' Moody's analysts led by Stanislas Rouyer in New York wrote in a report released today.To which industry's "value proposition" are ratings so important? The bond insurers or the CDO managers?
August Existing Home Sales
by Calculated Risk on 9/25/2007 02:00:00 PM
Note: I'm posting from the local library. Here are a couple of graphs I uploaded before Time Warner crashed this AM. Click on graph for larger image.
The first graph shows the NSA sales per month for the last 3 years.
The pattern of YoY declines in sales is continuing. Usually August is a stronger month than July, but this year NSA sales were essentially flat from July to August.
For existing homes sales are reported at the close of escrow. So August sales were for contracts signed in July and even June. Many of these transactions already had locked in their loans by the time the credit turmoil started at the beginning of August. Therefore I expect an even greater impact from tighter standards on reported sales in September. The second graph shows nationwide inventory for existing homes. According to NAR, inventory increased to an all time record 4,581,000 in August.
Total housing inventory rose 0.4 percent at the end of August to 4.58 million existing homes available for sale, which represents a 10.0-month supply at the current sales pace, up from a 9.5-month supply in July.This is basically the same inventory level as July, although the months of supply increased to 10 months because of the drop in sales.
This is the normal historical pattern for inventory - inventory peaks at the end of summer and then stay fairly flat until the holidays (it then usually declines somewhat). This says nothing about the increasing anxiety of sellers and the rising foreclosure sales.
Hopefully my ISP will be back online soon. Best to all.
A Clockwork Mortgage
by Anonymous on 9/25/2007 10:51:00 AM
I made an idle threat a while ago to write something about the negative convexity of mortgages--and options theory generally--but I haven't gotten around to punishing you all like that. I looks like I should. Exhibit ZZ in my never-ending war on "economist-underwritten loans" showed up this morning, courtesy of our WaitingInOC, and it's a doozy: "Surprise: Toxic Mortgages Are the Best."
This is a summary of an academic paper by professors Tomasz Piskorski and Alexei Tchistyi, the full text of which I don't have. If any of you do and feel the need to forward it on to me, why, go ahead. It has to be more fun than a sharp stick in the eye. What I can glean from the Reuters paraphrase suggests that it's about a massive campaign of borrower re-education designed to convince you that giving up your option to prepay and your fixed rate protection in exchange for a couple of nickels of interest is in your best interest, since investors who suddenly experience positive convexity with MBS--it's like perpetual Christmas morning--will give up all the resulting price gains in rate concessions to you, and interest rate cycles will be repealed. Or something. Remember that I am working with a summary here.
Right now is not the moment for the major UberNerd treatise on convexity, so suffice it to say that the main issue is the imbedded options in mortgage loans. In options theory terms, a mortgage gives the borrower a put (the right to default or "send jingle mail") and call (the right to prepay the mortgage with proceeds of a refinance or any other funds). Although both options have costs--especially if you have a prepayment penalty on your loan--those costs can end up being much lower than the cost of keeping your current mortgage. Because the "strike price" of these options is so heavily dependent on local and national economic conditions, interest rate levels, and home price changes, it is notoriously difficult to predict for any given borrower over any given stated loan maturity.
The lender, on the other hand, is "long a bond, short an option." Mortgages cannot be called or accelerated by the lender, except in case of default. No lender can make you refinance (although loan terms can certainly be created that will make you see that as your best option). If you are given a 30-year fixed rate, the lender must allow you to keep that rate for 30 years, even if it subsequently becomes uneconomic for the lender, as market rates rise and new investments would return more. On the other hand, if market rates drop, you may exercise your right to prepay, which means that the lender loses your old higher-rate mortgage and must reinvest its funds at new, lower market rates.
All this produces some difficulty in valuation of mortgage securities, since mortgages have a tendency to prepay at the worst time for the investor and to extend durations--stay on the books--when prepayments would be best for the investor. The mortgage origination industry--as distinct, here, from the investment community--has a lot at stake in making refinances fast, cheap, and easy, as each new loan is a new fee opportunity. But the lower the option cost of the borrower's "call," the less valuable the loan is to the investor (and servicer). Prepayment penalties have become, basically, an attempt to put the genie back into the bottle.
We think of the ARM mania so much in terms of payment "affordability" that we forget why lenders like them: the idea of an ARM is that, subject to some lags due to adjustment frequency, caps, index volatility, and so on, the ARM is designed to keep "repricing" itself to current market rates. Theoretically--and we are definitely in the realm of theory here--ARMs obviate the borrower's refinance option because a refinance would offer no better rate, as long as the ARM is "at market" at any point in its life and the refi rate is "at market." In the real world, of course, we've created enough "inefficiency" here with teasers, discounts, "lagging" indices, long adjustment intervals, and cap structures to make sure there's still--or there was until recently--plenty of incentive for borrowers with an ARM to refinance. Not coincidentally, we have used the best technology we can buy to make refis fast and cheap in terms of transaction costs, which we're perfectly happy to finance if even low upfront costs bother you.
"Until recently" is a way to speak volumes about the flaw in this plan: the refinance option depends as much on the value of the collateral as on the availability of cheap, easily-obtained mortgage money, and we have a little bit of a problem right now with that. As the LTV rises on a loan, that other option, the borrower's "put," gets a whole lot cheaper for the borrower and more expensive for the lender. Theoretically, the "perfect" loan, for the investor, would be one with no or minimal options for the borrower to call or put, and with a rate adjustment mechanism with very short reset invervals, large caps, and a highly sensitive (not "lagging") index. This ideal loan would prohibit prepayment or make it terribly expensive, and also allow the payment to fluctuate such that borrowers in a bit of an income or expense jam are less tempted to put the thing back in periods of home price declines.
Well then why, you ask, have we not invented this perfect loan? Apparently we're nearly there:
If you had to name the most toxic, dangerous, foolhardy kind of mortgage loan that exists, you'd very likely pick a pay-option ARM, which lets borrowers get deeper into debt by paying less than the minimum interest they owe each month and adding the unpaid interest to the loan principal. Worse yet, you might say, would be a pay-option ARM with a very high penalty for prepayment so borrowers can't get out of it easily once they're in it. There's a move afoot to ban these worst-of-the-worst loans.It's the best, not the perfect, because even though we've managed to stick the most onerous prepayment penalties on these loans that the law allows, we have yet to find a legal way to extend them to the life of the loan at a high enough penalty rate to make Option ARMs permanent loans. If we did that, you see, these things would be a fabulous deal; we would need only to "educate" borrowers about how giving up options is handsomely repaid in lower interest rates forever, and we're nearly there.
Guess what? The worst is actually the best.
If the optimal loan really is better for homeowners who behave rationally, maybe it makes sense to get people to behave rationally through extensive, even expensive, consumer education. In an interview, Piskorski told me that by his rough calculation, the benefits of the optimal mortgage vs. a conventional mortgage amount to a least half a percentage point of interest -- namely, $50 billion or more a year for the U.S. as a whole. In other words, you could devote many billions of dollars a year to consumer education about these misused-but-potentially-valuable loans and still come out ahead.Anyone who can determine who "you" is in that last sentence wins a free subscription to Calculated Risk. When dollars are being proposed to be spent, it is always wise to ask whose those dollars are.
And why are Option ARMs, in a perfect world, "optimal" for borrowers?
-- The option to pay less than the minimum monthly interest owed on the loan is valuable for people with good self-control whose income fluctuates a lot. They can pay just a little in lean months and catch up in fat months. It's good for lenders, too, because they don't have to foreclose on people who fall behind, which is an expensive process. People with steady incomes don't need this feature, but having it doesn't hurt them.We must, of course, leave aside "good self-control," because that will undoubtedly be covered in "our" training program. We will have to content ourselves with asking how, in a perfect world, incomes "fluctuate." In some tight band around a mean to which they revert? In that case, why would you not qualify the borrower at an interest only payment at the "bottom" of the band, allowing for sporadic principal payments when times are "fat," but preventing negative amortization? Perhaps we are really talking about incomes that never quite "fluctuate" up to where they need to in order to retire the debt? And how does this option not hurt people who don't need it, when it comes at the cost of losing the right to prepay and the inflation-protection of a fixed rate?
-- The fact that the loan is an ARM -- namely, its rate fluctuates with market interest rates -- is especially valuable to lenders. This is a subtler notion, but the idea is that if there are going to be a certain number of defaults in a pool of mortgages because of random bits of bad luck like a job loss or a divorce, the lender would prefer that they be concentrated during periods of high interest rates. Why? Because when market interest rates are high, the lender that forecloses and gets back (most of) its money can redeploy the cash in high-yielding alternatives. The lender would prefer not to foreclose and get its money back when rates are low and other options are unattractive. An ARM loan achieves what the lender wants. Borrowers, meanwhile, are neutral about whether they default in periods of high or low market interest rates.So "lenders" don't want to foreclose because it's expensive, except for the fact that apparently investors would like to see foreclosures happen when rates are high. Whether the additional cost of foreclosure in a high-rate environment doesn't offset reinvestment gains is a good question. All that high past-due interest has to be recouped out of the liquidation of the REO, and there is a theory about connections among RE values, marketing time, and high interest rates, you know.
Similarly I'd like to know why borrowers are "neutral" about default in various rate scenarios. But I am most interested in the idea that lenders wouldn't want to foreclose on an ARM when rates are low. It's, um, an ARM. Why would the rate on a new loan be lower than the rate on an existing ARM, in our perfect frictionless world? If there is in fact some friction here--the ARM rate is still higher than market in this falling rate environment--then where is this "discount" that these consumers got in exchange for giving up the refi option?
-- Finally, the economists say the optimal loan contract would outright ban getting a new loan from a different lender. There are no such bans. But they say that the prepayment penalties that are common in subprime loans are a good second best. How could that be? Because lenders will offer more favorable terms if they know that they'll be able to hang onto the loan long enough for it to be profitable. If they fear that the borrower will refinance at the drop of a hat, they'll give less favorable terms.OK, guys. What are "more favorable terms" on an ARM? I mean, you do not have to have the cynical response that lenders who know you can never get out of the contract will be motivated to extract as much out of you as possible short of forcing you into foreclosure to wonder where the deal comes in without the offer of a fixed rate.
The problem with those subprime ARMs, of course, is that while the borrowers did get a "discount" on the initial rate in exchange for that prepayment penalty, it is not at all clear to informed observers that it was much of a discount: you have to rule out the possibility of predatory lending, and assume perfect pricing of credit risk, in order to say that no borrower got a "discounted" subprime ARM that involved a higher rate than that borrower would have paid on an undiscounted FHA fixed rate. You also have pretend we haven't been having a major affordability problem with home prices in order to understand rate discounts as something other than "qualification" games, or simply a matter of rate concessions the lender makes solely because the alternative is no loan at all if you have to qualify at a "market" interest rate. A "teaser" is not a simple discount in exchange for a prepayment penalty; it's a means of getting you into a loan you cannot afford, because lenders who do not own the loan forever just want to make lots of loans.
You can, of course, assume anything you want in a "perfect world," but I notice these helpful economists are not proposing a massive educational campaign designed to teach lenders and servicers and investors not to be greedy, sociopathic cretins. We are proposing that "we" spend "our" money to teach "you" to understand that what is in our best interest--all the options on our side, none on yours, except your "option" to get deeper in debt each month--is really in your best interest.
Says Piskorski: "Obviously people are to some extent irrational. But if you want to ban this type of contract, you should really weigh the benefits and the costs. How much could you educate people? Make people understand them. Provide them with software. Make a federal law that requires the lender to reveal what this contract is about."In other words, we need to keep our toxic products but fire these irrational borrowers, replacing them with some trainees who can be brought to have more rational points of view. I suggest issuing this software with applications for Social Security Numbers; as soon as you begin to work for money, you should begin the process of understanding how to become contributing members of the "free market" by handing over your "pricing power" and behaving the way the rentier class wants you to.
I am not, of course, suggesting that there's no room for improvement in borrower education. I certainly don't think your "refi options" are always more about saving your money than about handing over fees to an industry that loves to "help you out." Nor do I claim that these academics are mere useful tools of the mortgage industry. However, I am reaffirming an old conviction of mine: there is no fruitcake like academic fruitcake.
Existing Home Sales 5.5 Million
by Calculated Risk on 9/25/2007 10:50:00 AM
My Internet Connection (Time Warner) is down.
From NAR Press Release.
Total existing-home sales – including single-family, townhomes, condominiums and co-ops – were down 4.3 percent to a seasonally adjusted annual rate1 of 5.50 million units in August from a level of 5.75 million in July, and are 12.8 percent below the 6.31 million-unit pace in August 2006.Graphs will be posted soon (hopefully).
Sales: 5.5 Million SAAR.
Months of Supply: 10.0
Best to all.
Home Prices Post Biggest Drop in 16 Years
by Calculated Risk on 9/25/2007 09:37:00 AM
From AP: Home Prices Post Biggest Drop in 16 Years
The decline in U.S. home prices accelerated nationwide in July, posting the steepest drop in 16 years, according to the S&P/Case-Shiller home price index released Tuesday.
Home prices have fallen by more every month since the beginning of the year.
An index of 10 U.S. cities fell 4.5 percent in July from a year ago. That was the biggest drop since July 1991.
"The further deceleration in prices is still apparent across the majority of regions," MacroMarkets LLC Chief Economist Robert Shiller said in a statement.

Table from the WSJ: Home Prices Tumble, Case-Shiller Index Reports
Monday, September 24, 2007
Lowe's and Target Warn
by Calculated Risk on 9/24/2007 05:45:00 PM
From Reuters: Lowe's warns profit could trail prior forecast
The second-largest home improvement chain behind Home Depot Inc ... said "current sales are trending below" expectations as drought in the mid-Atlantic, Southeastern and Western parts of the United States hurt sales of outdoor products.From MarketWatch: Target cuts September sales outlook
Target Corp. on Monday evening cut its forecast for September sales at stores open more than a year to an increase of 1.5% to 2.5%, down from its previous forecast of 4% to 6%. In a recorded message, the Minneapolis-based discount retailer said there was weaker guest traffic in September than expected ...Is this the start of Hamlet Act V?.
Roubini on Housing
by Calculated Risk on 9/24/2007 04:13:00 PM
Here is a video of Nouriel Roubini on CNBC this morning.
Also, the Video of the Day (bottom of the posts) is a great interview with Alan Greenspan.


