 RSS Feed
 by Calculated Risk on 7/27/2025 07:46:00 PM
Sunday, July 27, 2025
Sunday Night Futures
Weekend:
• Schedule for Week of July 27, 2025
Monday:
• At 10:00 AM ET, the Q2 2025 Housing Vacancies and Homeownership from the Census Bureau.
• At 10:30 AM, Dallas Fed Survey of Manufacturing Activity for July.
From CNBC: Pre-Market Data and Bloomberg futures S&P 500 are up 28 and DOW futures are up 168 (fair value).
Oil prices were down over the last week with WTI futures at $65.16 per barrel and Brent at $68.44 per barrel. A year ago, WTI was at $79, and Brent was at $81 - so WTI oil prices are down about 20% year-over-year.
Here is a graph from Gasbuddy.com for nationwide gasoline prices. Nationally prices are at $3.12 per gallon. A year ago, prices were at $3.49 per gallon, so gasoline prices are down $0.37 year-over-year.
FOMC Preview: No Change to Fed Funds Rate
by Calculated Risk on 7/27/2025 09:01:00 AM
Most analysts expect no change to FOMC policy at the meeting this week, keeping the target range at 4 1/4 to 4 1/2 percent. Market participants currently expect the FOMC to cut the Fed Funds rate 25bp in September, with a second rate cut in December.
From BofA:
We do not expect any policy changes at the July Fed meeting. Most FOMC participants likely view this meeting as a placeholder. The balance of risks remains the same as in June: to the upside on inflation and to the downside on the labor market. The Fed will have a lot more information on how these risks have evolved by the September meeting. ...
August’s Jackson Hole Symposium further reduces the urgency to guide markets next week. The Fed will have an additional month’s worth of data by then. With the benefit of hindsight, it is clear that Powell used his Jackson Hole speech last year to signal the 50bp cut in September. This year, Powell will most likely be speaking on the morning of August 22. Although the focus will be on the framework review, we see a strong chance that Powell will also provide a signal on the near-term policy trajectory.
emphasis added
Projections will NOT be released at this meeting. For review, here are the June projections.
1 Projections of change in real GDP and inflation are from the fourth quarter of the previous year to the fourth quarter of the year indicated.
The unemployment rate was at 4.1% in June. The unemployment rate will likely increase later this year.
2 Projections for the unemployment rate are for the average civilian unemployment rate in the fourth quarter of the year indicated.
As of May 2025, PCE inflation increased 2.3% year-over-year (YoY), up from 2.2% YoY in April. Early estimate is PCE inflation will increase to 2.6% YoY in June. There will likely be some further increases in the 2nd half of 2025, but the forecast range is probably reasonable.
PCE core inflation increased 2.7% YoY in May, up from 2.6% YoY in April. There will likely be further increase in core PCE inflation.
Since the last projections were released, economic growth has been below expectations, the unemployment rate and inflation close to expectations.
The BEA's estimate for Q1 GDP showed real growth at -0.5% annualized. Most estimates for Q2 GDP, are around 2.5% (as distortions in Q1 reverse). That would put the first half real growth at 1.0% annualized, and it is likely growth will also be slow the 2nd half of 2025.
| GDP projections of Federal Reserve Governors and Reserve Bank presidents, Change in Real GDP1 | ||||
|---|---|---|---|---|
| Projection Date | 2025 | 2026 | 2027 | |
| Jun 2025 | 1.2 to 1.5 | 1.5 to 1.8 | 1.7 to 2.0 | |
| Mar 2025 | 1.5 to 1.9 | 1.6 to 1.9 | 1.6 to 2.0 | |
The unemployment rate was at 4.1% in June. The unemployment rate will likely increase later this year.
| Unemployment projections of Federal Reserve Governors and Reserve Bank presidents, Unemployment Rate2 | ||||
|---|---|---|---|---|
| Projection Date | 2025 | 2026 | 2027 | |
| Jun 2025 | 4.4 to 4.5 | 4.3 to 4.6 | 4.2 to 4.6 | |
| Mar 2025 | 4.3 to 4.4 | 4.2 to 4.5 | 4.1 to 4.4 | |
As of May 2025, PCE inflation increased 2.3% year-over-year (YoY), up from 2.2% YoY in April. Early estimate is PCE inflation will increase to 2.6% YoY in June. There will likely be some further increases in the 2nd half of 2025, but the forecast range is probably reasonable.
| Inflation projections of Federal Reserve Governors and Reserve Bank presidents, PCE Inflation1 | ||||
|---|---|---|---|---|
| Projection Date | 2025 | 2026 | 2027 | |
| Jun 2025 | 2.8 to 3.2 | 2.3-2.6 | 2.0 to 2.2 | |
| Mar 2025 | 2.6 to 2.9 | 2.1 to 2.3 | 2.0 to 2.1 | |
PCE core inflation increased 2.7% YoY in May, up from 2.6% YoY in April. There will likely be further increase in core PCE inflation.
| Core Inflation projections of Federal Reserve Governors and Reserve Bank presidents, Core Inflation1 | ||||
|---|---|---|---|---|
| Projection Date | 2025 | 2026 | 2027 | |
| Jun 2025 | 2.9 to 3.4 | 2.3-2.6 | 2.0 to 2.2 | |
| Mar 2025 | 2.7 to 3.0 | 2.1 to 2.4 | 2.0 to 2.1 | |
Saturday, July 26, 2025
Real Estate Newsletter Articles this Week: Existing-Home Sales Decreased to 3.93 million SAAR in June
by Calculated Risk on 7/26/2025 02:11:00 PM
At the Calculated Risk Real Estate Newsletter this week:
 Click on graph for larger image.
• NAR: Existing-Home Sales Decreased to 3.93 million SAAR in June; Unchanged YoY
• New Home Sales Increase to 627,000 Annual Rate in June
• Final Look at Local Housing Markets in June and a Look Ahead to July Sales
• NMHC on Apartments: Market conditions Tightened in Q2
• Goldman's Mid-Year Housing Outlook
• California Home Sales Down Slightly YoY in June
This is usually published 4 to 6 times a week and provides more in-depth analysis of the housing market.
Schedule for Week of July 27, 2025
by Calculated Risk on 7/26/2025 08:11:00 AM
The key reports this week are the advance estimate of Q2 GDP and the July employment report.
Other key reports include May Case-Shiller house prices, July ISM manufacturing index and July vehicle sales.
The FOMC meets this week and no change to the Fed Funds rate is expected.
10:00 AM: the Q2 2025 Housing Vacancies and Homeownership from the Census Bureau.
10:30 AM: Dallas Fed Survey of Manufacturing Activity for July.
 9:00 AM: S&P/Case-Shiller House Price Index for May.
This graph shows the year-over-year change in the seasonally adjusted National Index, Composite 10 and Composite 20 indexes through the most recent report (the Composite 20 was started in January 2000).
The consensus is for a 2.5% year-over-year increase in the Comp 20 index for May.
9:00 AM: FHFA House Price Index for May. This was originally a GSE only repeat sales, however there is also an expanded index.
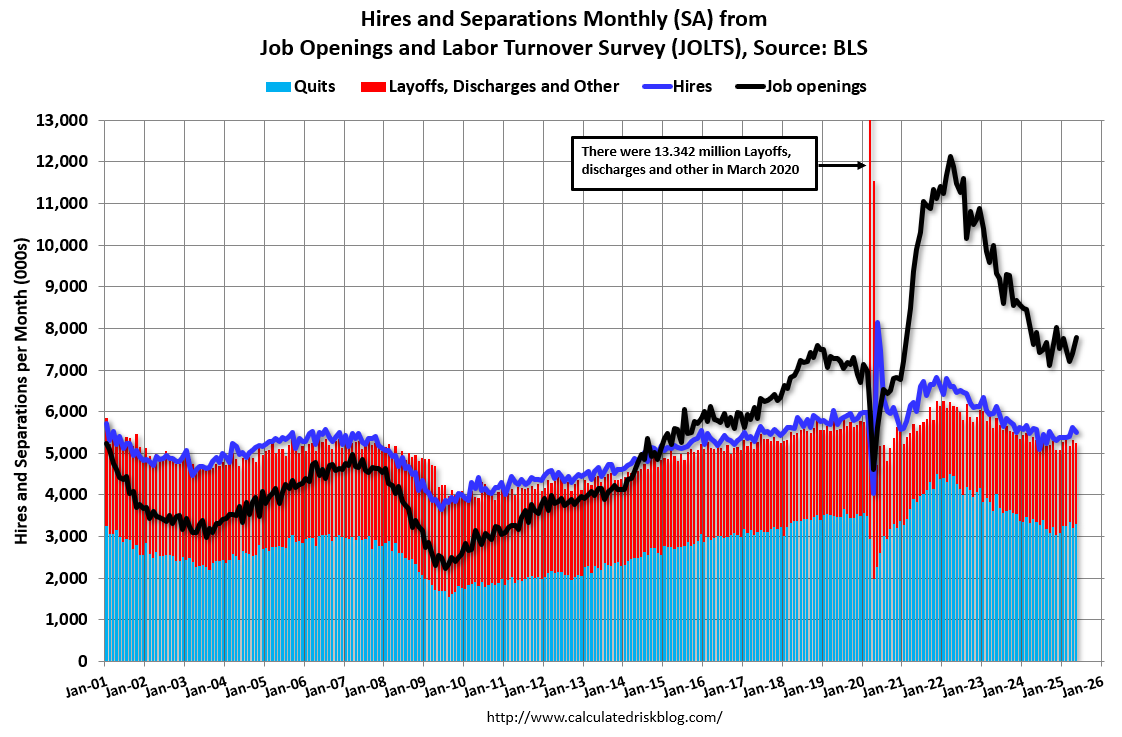 10:00 AM ET: Job Openings and Labor Turnover Survey for June from the BLS.
 This graph shows job openings (yellow line), hires (purple), Layoff, Discharges and other (red column), and Quits (light blue column) from the JOLTS.
Jobs openings increased in May to 7.77 million from 7.40 million in April.
The number of job openings (yellow) were down 2% year-over-year and Quits were down 2% year-over-year.
7:00 AM ET: The Mortgage Bankers Association (MBA) will release the results for the mortgage purchase applications index.
8:15 AM: The ADP Employment Report for June. This report is for private payrolls only (no government). The consensus is for 75,000 payroll jobs added in June, up from -33,000 in May.
8:30 AM: Gross Domestic Product, 2nd quarter (advance estimate), and annual update. The consensus is that real GDP increased 2.5% annualized in Q2, up from -0.5% in Q1.
10:00 AM: Pending Home Sales Index for June. The consensus is for a 0.3% increase in the index.
2:00 PM: FOMC Meeting Announcement. No change to the Fed Funds rate is expected.
2:30 PM: Fed Chair Jerome Powell holds a press briefing following the FOMC announcement.
8:30 AM: The initial weekly unemployment claims report will be released. The consensus is for initial claims to increase to 220 thousand from 217 thousand last week.
8:30 AM ET: Personal Income and Outlays, June 2025. The consensus is for a 0.3% increase in personal income, and for a 0.4% increase in personal spending. And for the Core PCE price index to increase 0.3%. PCE prices are expected to be up 2.5% YoY, and core PCE prices up 2.7% YoY.
9:45 AM: Chicago Purchasing Managers Index for July.
 8:30 AM: Employment Report for July. The consensus is for 118,000 jobs added, and for the unemployment rate to increase to 4.2%.
There were 147,000 jobs added in June, and the unemployment rate was at 4.1%.
This graph shows the jobs added per month since January 2021.
10:00 AM: ISM Manufacturing Index for July. The consensus is for the ISM to be at 49.8, up from 49.0 in June.
10:00 AM: Construction Spending for June. The consensus is for a 0.1% increase in construction spending.
10:00 AM: University of Michigan's Consumer sentiment index (Final for July).
 Late: Light vehicle sales for July from the BEA. The consensus is for light vehicle sales to be 16.2 million SAAR in July, up from 15.3 million in June (Seasonally Adjusted Annual Rate).
This graph shows light vehicle sales since the BEA started keeping data in 1967. The dashed line is the sales rate for last month.
Friday, July 25, 2025
Realtor.com Reports Most Active "For Sale" Inventory since November 2019
by Calculated Risk on 7/25/2025 05:01:00 PM
What this means: On a weekly basis, Realtor.com reports the year-over-year change in active inventory and new listings. On a monthly basis, they report total inventory. For June, Realtor.com reported inventory was up 28.9% YoY, but still down 12.9% compared to the 2017 to 2019 same month levels.
Here is their weekly report: Weekly Housing Trends: Latest Data as of July 19
• Active inventory climbed 24.4% year over year
The number of homes active on the market climbed 24.4% year over year, slightly lower than last week. This represents the 89th consecutive week of annual gains in inventory. There were more than 1 million homes for sale again last week, marking the 11th week in a row over the threshold and the highest inventory level since November 2019.
• New listings—a measure of sellers putting homes up for sale—rose 7.2% year over year
New listings rose again last week on an annual basis by 7.2% compared with the same period last year. The June Housing Report showed that new listings declined month over month for the second consecutive month after peaking in April. This figure suggests that the trend could turn around soon.
• The median list price was up 0.8% year over year
The median list price climbed again this week, but is still down 0.2% year to date. The median list price per square foot—which adjusts for changes in home size—rose 0.5% year over year. With inventory on the rise and more than 1 in 5 sellers cutting prices, the market continues to soften and shift toward more buyer favorability.
Q2 GDP Tracking: Mid-2s
by Calculated Risk on 7/25/2025 02:01:00 PM
The advance estimate of Q2 GDP will be released next Wednesday. The consensus is real GDP increased at a 2.5% annual rate in Q2. BofA economists noted this morning:
"The increase in the headline print would be on the back of a reversal of the surge in imports due to pre-tariff front loading in 1Q. Consumer spending should increase by 1.5% after the weather-driven 1Q decline. Equipment investment is likely to decline after the outsized increase in 1Q. Hence final sales will likely come in at a weak 0.3%."From BofA:
Since our last weekly publication, our 2Q GDP tracking is unchanged at 2.2% q/q saar. [July 25th estimate]From Goldman:
emphasis added
We left our Q2 GDP tracking estimate unchanged at +2.7% (quarter-over-quarter annualized) and our Q2 domestic final sales estimate unchanged at +0.9%. [July 25th estimate]And from the Atlanta Fed: GDPNow

The GDPNow model estimate for real GDP growth (seasonally adjusted annual rate) in the second quarter of 2025 is 2.4 percent on July 25, unchanged from July 18 after rounding. The forecasts of the major GDP subcomponents were all unchanged or little changed from their July 18 values after this week’s releases from the US Census Bureau and the National Association of Realtors. [July 25th estimate]
Final Look at Local Housing Markets in June and a Look Ahead to July Sales
by Calculated Risk on 7/25/2025 10:56:00 AM
Today, in the Calculated Risk Real Estate Newsletter: Final Look at Local Housing Markets in June and a Look Ahead to July Sales
A brief excerpt:
After the National Association of Realtors® (NAR) releases the monthly existing home sales report, I pick up additional local market data that is reported after the NAR. This is the final look at local markets in June.There is much more in the article.
There were several key stories for June:
• Sales NSA are down 1.5% year-over-year (YoY) through June compared to the same period in 2024, and sales last year were the lowest since 1995! The YoY comparisons will be fairly easy for the next three months, so sales in 2025 might be close to the level in 2024.
• Sales SA were down or unchanged YoY for the 5th consecutive month and have been down YoY for 41 of the last 46 months.
• Months-of-supply is at the highest level since 2016.
• The median price is barely up YoY, and with the increases in inventory, some regional areas will see more price declines - and we might see national price declines later this year (or in 2026).
Sales at 3.93 million on a Seasonally Adjusted Annual Rate (SAAR) basis were below the consensus estimate; however, housing economist Tom Lawler’s estimate was right on (usually very close).
Sales averaged close to 5.40 million SAAR for the month of June in the 2017-2019 period. So, sales are about 27% below pre-pandemic levels.
...
In June, sales in these markets were up 4.7% YoY NSA. Last month, in May, these same markets were also down 3.8% YoY Not Seasonally Adjusted (NSA). The NAR reported sales in June were up 4.0% YoY NSA, so this sample is close.
Important: There were more working days in June 2025 (20) than in June 2024 (19). So, the year-over-year change in the headline SA data was lower than for the NSA data. According to the NAR, seasonally adjusted sales were unchanged YoY in June.
...
More local data coming in August for activity in July!

Hotels: Occupancy Rate Decreased 2.6% Year-over-year; Weak Summer
by Calculated Risk on 7/25/2025 08:11:00 AM
The U.S. hotel industry reported negative year-over-year comparisons, according to CoStar’s latest data through 19 July. ...The following graph shows the seasonal pattern for the hotel occupancy rate using the four-week average.
13-19 July 2025 (percentage change from comparable week in 2024):
• Occupancy: 71.6% (-2.6%)
• Average daily rate (ADR): US$165.49 (-0.7%)
• Revenue per available room (RevPAR): US$118.54 (-3.3%)
emphasis added
 Click on graph for larger image.
The red line is for 2025, blue is the median, and dashed light blue is for 2024. Dashed purple is for 2018, the record year for hotel occupancy.
The 4-week average of the occupancy rate is tracking behind last year and the median rate for the period 2000 through 2024 (Blue).
Note: Y-axis doesn't start at zero to better show the seasonal change.
The 4-week average will likely increase over the next several weeks.
On a year-to-date basis, the only worse years for occupancy over the last 25 years were pandemic or recession years.
Thursday, July 24, 2025
Friday: Durable Goods
by Calculated Risk on 7/24/2025 07:54:00 PM
 Note: Mortgage rates are from MortgageNewsDaily.com and are for top tier scenarios.
Friday:
• At 8:30 AM ET,Durable Goods Orders for June from the Census Bureau. The consensus is for a 10.0% decrease in durable goods orders.
July Vehicle Forecast: Sales "Rebound"
by Calculated Risk on 7/24/2025 04:21:00 PM
From J.D. Power: New-Vehicle Retail Sales Up 4.1% for July and Consumer Spending Sets Record for Month with $49.8 Billion Spent on New Vehicles Brief excerpt:
The seasonally adjusted annualized rate (SAAR) for total new-vehicle sales is expected to be 16.4 million units, up 0.8 million units from July 2024.From Haig Stoddard at Omdia: US Light Vehicle Sales Headed for Rebound in July (pay content). Brief excerpt:
emphasis added
July US light-vehicle sales will improve on June's results, as the expected negative impacts from automotive tariffs are yet to fully kick in.
 Click on graph for larger image.
This graph shows actual sales from the BEA (Blue), and J.D. Power's forecast for July (Red).
On a seasonally adjusted annual rate basis, the J.D. Power forecast of 16.4 million SAAR would be down 6.9% from last month, and up 3.6% from a year ago.


