 RSS Feed
 by Calculated Risk on 7/14/2025 07:43:00 PM
Monday, July 14, 2025
Tuesday: CPI, NY Fed Mfg
 From Matthew Graham at Mortgage News Daily: Mortgage Rates Just a Hair Higher Ahead of Important Inflation Report
Today's movement in mortgage rates, in and of itself, is barely worth mentioning. The average lender remains close enough to Friday's levels but is technically just a hair higher. That fact is offset by the counterpoint that most of the past two months saw higher rates.Tuesday:
The future is far more interesting than the present--specifically, the immediate future. Tomorrow morning brings the release of the Consumer Price Index (CPI). This is one of the most important economic reports as far as interest rates are concerned and tomorrow's example is especially notable.
This CPI marks the first major opportunity for the official data to show (or not show) a meaningful impact on inflation from tariffs.[30 year fixed 6.83%]
emphasis added
• At 8:30 AM ET, The Consumer Price Index for June from the BLS. The consensus is for a 0.3% increase in CPI, and a 0.3% increase in core CPI. The consensus is for CPI to be up 2.6% year-over-year and core CPI to be up 2.9% YoY.
• Also at 8:30 AM, The New York Fed Empire State manufacturing survey for July. The consensus is for a reading of -10.1, up from -16.0.
CPI Preview
by Calculated Risk on 7/14/2025 02:31:00 PM
The Consumer Price Index for May is scheduled to be released tomorrow. The Consumer Price Index for June from the BLS. The consensus is for a 0.3% increase in CPI, and a 0.3% increase in core CPI. The consensus is for CPI to be up 2.6% year-over-year and core CPI to be up 2.9% YoY.
From Goldman Sachs economists:
We expect a 0.23% increase in June core CPI (vs. +0.3% consensus), corresponding to a year-over-year rate of 2.93% (vs. +3.0% consensus). We expect a 0.30% increase in headline CPI (vs. +0.3% consensus), reflecting higher food prices (+0.25%) and energy prices (+1.2%).From BofA:
...
Going forward, tariffs will likely provide a somewhat larger boost to monthly inflation, and we expect monthly core CPI inflation between 0.3-0.4% over the next few months.
We forecast headline and core CPI to print at 0.3% m/m in June, which would be a notable acceleration from the recent trend. Stronger price hikes for core goods, discretionary services, and medical services should drive the pickup in core inflation. Based on our forecast, we project core PCE to print at 0.22% m/m in June, which would lower the likelihood of a September cut.Note that month-to-month inflation was soft in May and June 2024.
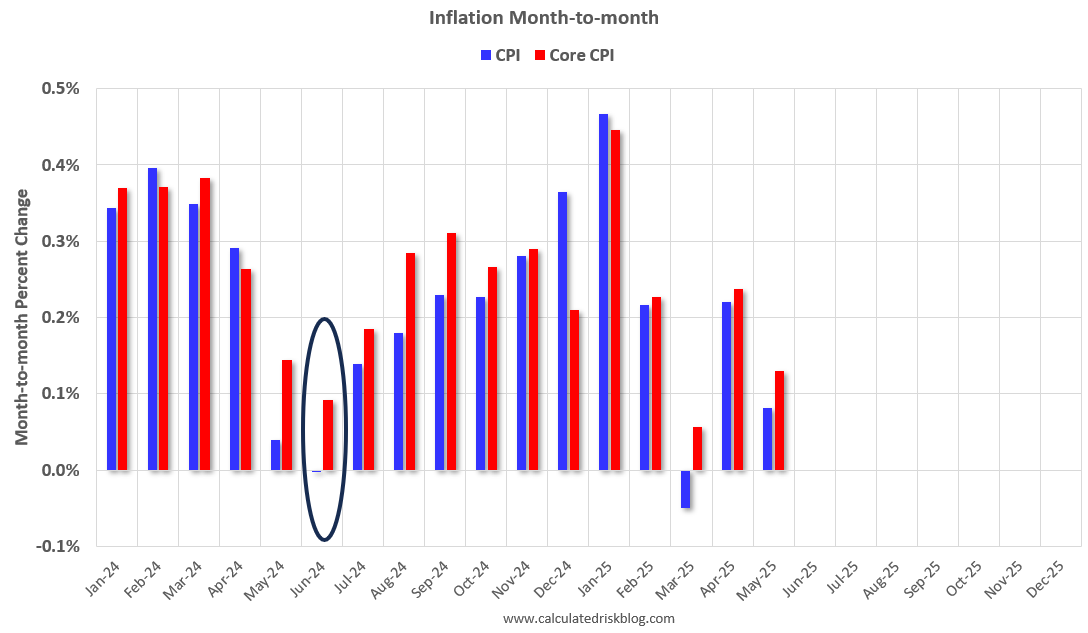 Click on graph for larger image.
This graph shows the month-to-month change in both headline and core inflation since January 2024.
The circled area is the change for last when inflation was soft. CPI was down fractionally in June 2024, and core CPI was up 0.09%.
So even a somewhat benign reading in June will push up year-over-year inflation.
Starting in July, the tariff related inflation is expected to kick in.
Will House Prices Decline Nationally in 2025?
by Calculated Risk on 7/14/2025 11:26:00 AM
Today, in the Calculated Risk Real Estate Newsletter: Will House Prices Decline Nationally in 2025?
A brief excerpt:
Most forecasts for 2025 were for U.S. house prices to increase modestly in the 3% to 4% range. My early view was “mostly flat prices nationally in 2025” with some areas seeing price declines. I didn’t expect either a crash in prices or a surge in prices.There is much more in the article.
With inventory increasing, year-over-year (YoY) price growth has slowed nationally, and declining in many areas. The following table shows the YoY price slowdown. Note that the median price is impacted by the mix of homes sold.
The seasonally adjusted Case-Shiller National Index is essentially unchanged year-to-date (YTD). The index was at 327.81 in December 2024 and was at 327.90 in the April report.
And the Freddie Mac HPI SA is down slightly YTD. The index was at 299.29 in December, and is now at 297.69, a decline of 0.5%.
Other measures are also indicating a slowdown in the YoY growth, but not a collapse in prices.

Housing July 14th Weekly Update: Inventory down 0.7% Week-over-week, Down 11% from 2019 Levels
by Calculated Risk on 7/14/2025 08:11:00 AM
Altos reports that active single-family inventory was down 0.7% week-over-week.
Inventory is now up 35.6% from the seasonal bottom in January and will likely be mostly flat over the summer.
Usually, inventory is up about 20% from the seasonal low by this week in the year. So, 2025 is seeing a larger than normal increase in inventory.
The first graph shows the seasonal pattern for active single-family inventory since 2015.
 Click on graph for larger image.
The red line is for 2025. The black line is for 2019.
Inventory was up 30.0% compared to the same week in 2024 (last week it was up 30.8%), and down 11.0% compared to the same week in 2019 (last week it was down 10.0%).
It now appears inventory will be close to 2019 levels towards the end of 2025.
 This second inventory graph is courtesy of Altos Research.
As of July 11th, inventory was at 847 thousand (7-day average), compared to 853 thousand the prior week.
Mike Simonsen discusses this data regularly on Youtube
Sunday, July 13, 2025
Sunday Night Futures
by Calculated Risk on 7/13/2025 06:13:00 PM
Weekend:
• Schedule for Week of July 13, 2025
Monday:
• No major economic releases scheduled.
From CNBC: Pre-Market Data and Bloomberg futures S&P 500 are down 26 and DOW futures are down 185 (fair value).
Oil prices were up over the last week with WTI futures at $68.45 per barrel and Brent at $70.36 per barrel. A year ago, WTI was at $83, and Brent was at $87 - so WTI oil prices are down about 18% year-over-year.
Here is a graph from Gasbuddy.com for nationwide gasoline prices. Nationally prices are at $3.11 per gallon. A year ago, prices were at $3.50 per gallon, so gasoline prices are down $0.39 year-over-year.
Saturday, July 12, 2025
Real Estate Newsletter Articles this Week: Months-of-supply is higher than the previous 8 years!
by Calculated Risk on 7/12/2025 02:11:00 PM
At the Calculated Risk Real Estate Newsletter this week:
 Click on graph for larger image.
• Part 1: Current State of the Housing Market; Overview for mid-July 2025
• Part 2: Current State of the Housing Market; Overview for mid-July 2025
• 2nd Look at Local Housing Markets in June
• July ICE Mortgage Monitor: Home Prices Continue to Cool, Early Signs of Homeowner Risk Emerge
• 1st Look at Local Housing Markets in June
This is usually published 4 to 6 times a week and provides more in-depth analysis of the housing market.
Schedule for Week of July 13, 2025
by Calculated Risk on 7/12/2025 08:11:00 AM
The key reports this week are June CPI, Retail Sales and Housing Starts.
For manufacturing, the June Industrial Production report and the July New York and Philly Fed manufacturing surveys will be released.
No major economic releases scheduled.
8:30 AM: The Consumer Price Index for June from the BLS. The consensus is for a 0.3% increase in CPI, and a 0.3% increase in core CPI. The consensus is for CPI to be up 2.6% year-over-year and core CPI to be up 2.9% YoY.
8:30 AM: The New York Fed Empire State manufacturing survey for July. The consensus is for a reading of -10.1, up from -16.0.
7:00 AM ET: The Mortgage Bankers Association (MBA) will release the results for the mortgage purchase applications index.
8:30 AM: The Producer Price Index for June from the BLS. The consensus is for a 0.2% increase in PPI, and a 0.2% increase in core PPI.
 9:15 AM: The Fed will release Industrial Production and Capacity Utilization for June.
This graph shows industrial production since 1967.
The consensus is for a 0.1% increase in Industrial Production, and for Capacity Utilization to be unchanged at 77.4%.
2:00 PM: the Federal Reserve Beige Book, an informal review by the Federal Reserve Banks of current economic conditions in their Districts.
8:30 AM: The initial weekly unemployment claims report will be released. The consensus is for initial claims to decrease to 225 thousand from 227 thousand last week.
 8:30 AM: Retail sales for June is scheduled to be released. The consensus is for a 0.2% increase in retail sales.
This graph shows retail sales since 1992. This is monthly retail sales and food service, seasonally adjusted (total and ex-gasoline).
8:30 AM: the Philly Fed manufacturing survey for July. The consensus is for a reading of -0.5, up from -4.0.
10:00 AM: The July NAHB homebuilder survey. The consensus is for a reading of 33, up from 32. Any number below 50 indicates that more builders view sales conditions as poor than good.
10:00 AM: Speech, Fed Governor Adriana Kugler, A View of the Housing Market and U.S. Economic Outlook, At the Housing Partnership Network Symposium, Washington, D.C.
 8:30 AM ET: Housing Starts for June.
 This graph shows single and multi-family housing starts since 2000.
The consensus is for 1.300 million SAAR, up from 1.256 million SAAR in May.
10:00 AM: University of Michigan's Consumer sentiment index (Preliminary for July).
10:00 AM: State Employment and Unemployment (Monthly) for June 2025
Friday, July 11, 2025
"The Office Sector’s Double Whammy"; Record High Office Vacancy Rate
by Calculated Risk on 7/11/2025 03:55:00 PM
From Nick Villa at Moody's The Office Sector’s Double Whammy
The ongoing challenges affecting the office sector have not only resulted in deteriorating space market fundamentals—evidenced by the record-high national office vacancy rate in the second quarter of 2025—but have also had a direct negative impact on capital market activities, including the performance of commercial mortgage-backed securities (CMBS). Figure 1 illustrates the office sector’s “double whammy”—in particular, record-high vacancy rates and CMBS conduit delinquency rates. Specifically, the chart benchmarks the cumulative change in each of these metrics going back to the end of 2019. While the U.S. office vacancy rate has increased by nearly four percentage points over this period, the rise in office-backed CMBS delinquency has been significantly higher at around 11 percentage points.

As one would expect, vacancy rates have slowly inched higher from weaker tenant demand and new supply entering the market, while the long-term nature of most office leases has helped delay the full impact on net operating income. Consequently, this has temporarily masked the underlying CMBS distress, which has recently become more apparent through rising loan delinquencies and declining property valuations. For example, the office-backed CMBS delinquency rate increased by approximately 600 basis points in 2024, which was the fastest annual increase on record since data collection began in 2000. In other words, 2024’s full-year delinquency spike even outpaced levels seen during the Global Financial Crisis (GFC). Concerningly, however, the first six months of 2025 reflected the fastest midyear increase on record, underscoring the unique structural challenges now facing the sector.
 The second graph shows the office vacancy rate over time.
Moody’s Analytics reported that the office vacancy rate was at 20.7% in Q2 2025, up from 20.4% in Q1 2025, and up from 20.1% in Q2 2024.
This is the highest vacancy rate on record and is above the 19.3% peak during the S&L crisis.
Realtor.com Reports Most Active "For Sale" Inventory since December 2019
by Calculated Risk on 7/11/2025 02:48:00 PM
What this means: On a weekly basis, Realtor.com reports the year-over-year change in active inventory and new listings. On a monthly basis, they report total inventory. For May, Realtor.com reported inventory was up 28.9% YoY, but still down 12.9% compared to the 2017 to 2019 same month levels.
Here is their weekly report: Weekly Housing Trends: Latest Data as of July 5
• Active inventory climbed 26.7% year-over-year
The number of homes actively for sale remains on a strong upward trajectory, virtually unchanged from last week, at 26.7% higher than this time last year. This represents the 87th consecutive week of annual gains in inventory. There were more than 1 million homes for sale again last week, marking the ninth week in a row over the threshold and the highest inventory level since December 2019.
• New listings—a measure of sellers putting homes up for sale—rose 9.3% year over year
New listings rose again last week on an annual basis, up 9.3% compared with the same period last year.
• he median list price was up 0.2% year over year
The median list price climbed again this week but is still down 0.3% year to date. The median list price per square foot—which adjusts for changes in home size—rose 0.8% year over year. With inventory on the rise and more than 1 in 5 sellers cutting prices, the market is tilting back toward balance, marked by slowing price growth and increasing buyer leverage.
Q2 GDP Tracking: Mid-to-high 2s
by Calculated Risk on 7/11/2025 11:40:00 AM
From BofA:
Since our last weekly publication, our 2Q GDP tracking is down two-tenths to 2.3% q/q saar. [July 11th estimate]From Goldman:
emphasis added
[W]e have lowered our Q2 GDP tracking estimate by 0.6pp to +3.0% (quarter-over-quarter annualized). Our Q2 domestic final sales estimate stands at +0.7%. [July 3rd estimate]And from the Atlanta Fed: GDPNow

The GDPNow model estimate for real GDP growth (seasonally adjusted annual rate) in the second quarter of 2025 is 2.6 percent on July 9, unchanged from July 3 after rounding. After this morning's wholesale trade report from the US Census Bureau, the nowcast of second-quarter real residential fixed investment growth decreased from -6.4 percent to -6.5 percent, while the nowcast of the contribution of inventory investment to annualized second-quarter real GDP growth decreased from -2.13 percentage points to -2.15 percentage points. [July 9th estimate]


