 RSS Feed
 by Calculated Risk on 6/26/2025 08:30:00 AM
Thursday, June 26, 2025
Weekly Initial Unemployment Claims Decrease to 236,000
The DOL reported:
In the week ending June 21, the advance figure for seasonally adjusted initial claims was 236,000, a decrease of 10,000 from the previous week's revised level. The previous week's level was revised up by 1,000 from 245,000 to 246,000. The 4-week moving average was 245,000, a decrease of 750 from the previous week's revised average. The previous week's average was revised up by 250 from 245,500 to 245,750.The following graph shows the 4-week moving average of weekly claims since 1971.
emphasis added
 Click on graph for larger image.
The dashed line on the graph is the current 4-week average. The four-week average of weekly unemployment claims decreased to 245,000.
The previous week was revised up.
Weekly claims were close to the consensus forecast.
Wednesday, June 25, 2025
Thursday: GDP, Unemployment Claims, Durable Goods, Pending Home Sales
by Calculated Risk on 6/25/2025 07:59:00 PM
 Note: Mortgage rates are from MortgageNewsDaily.com and are for top tier scenarios.
Thursday:
• At 8:30 AM: The initial weekly unemployment claims report will be released. The consensus is for initial claims to increase to 247 thousand from 245 thousand last week.
• At 8:30 AM: Gross Domestic Product, 1st quarter 2024 (Third estimate). The consensus is that real GDP decreased 0.2% annualized in Q1, unchanged from the second estimate of a 0.2% decrease.
• At 8:30 AM: Durable Goods Orders for May from the Census Bureau. The consensus is for a 4.5% increase in durable goods orders.
• At 8:30 AM ET: Chicago Fed National Activity Index for May. This is a composite index of other data.
• At 10:00 AM: Pending Home Sales Index for May. The consensus is for a 0.1% increase in this index.
• At 11:00 AM: the Kansas City Fed manufacturing survey for June.
• During the Day: Census Bureau releases the Vintage 2024 Population Estimates
June Vehicle Forecast: Sales "Subdued" at 15.0 million SAAR
by Calculated Risk on 6/25/2025 03:56:00 PM
From J.D. Power: June New-Vehicle Sales Subdued After Reverse of Tariff-Driven Rush to Showrooms; Retail Sales Rise 7.5% in First Half of 2025 Brief excerpt:
The seasonally adjusted annualized rate (SAAR) for total new-vehicle sales is expected to be 15.0 million units, up 0.2 million units from June 2024.From Haig Stoddard at Omdia: US Light-Vehicle Sales Slow Again in June (pay content). Brief excerpt:
emphasis added
Much of June’s anticipated 12-month-low in the seasonally adjusted annualized rate is an offset from pre-tariff pull-ahead volume in March and April. But also dampening demand is worsening affordability and leaner inventory. Furthermore, a dent in the year-ago month’s sales caused by a cyberattack impacting dealers’ online systems is making year-over-year comparisons look stronger than they would have otherwise.
 Click on graph for larger image.
This graph shows actual sales from the BEA (Blue), and J.D. Power's forecast for June (Red).
On a seasonally adjusted annual rate basis, the J.D. Power forecast of 15.0 million SAAR would be down 4.1% from last month, and up slightly from a year ago.
Car buyers rushed to buy in March and April to beat the tariffs. As Stoddard noted, the year-over-year comparison is easy due to the cyberattack suppressing sales last June.
A few comments on the Seasonal Pattern for House Prices
by Calculated Risk on 6/25/2025 02:11:00 PM
Another update ... a few key points:
1) There is a clear seasonal pattern for house prices.
2) The surge in distressed sales during the housing bust distorted the seasonal pattern. This was because distressed sales (at lower price points) happened at a steady rate all year, while regular sales followed the normal seasonal pattern. This made for larger swings in the seasonal factor during the housing bust.
3) The seasonal swings have increased recently without a surge in distressed sales.
 Click on graph for larger image.
This graph shows the month-to-month change in the NSA Case-Shiller National index since 1987 (through April 2025). The seasonal pattern was smaller back in the '90s and early '00s and increased once the bubble burst.
The seasonal swings declined following the bust, however the pandemic price surge changed the month-over-month pattern.
The peak MoM increase in NSA prices this year was the smallest since 2008!
 The second graph shows the seasonal factors for the Case-Shiller National index since 1987. The factors started to change near the peak of the bubble, and really increased during the bust since normal sales followed the regular seasonal pattern - and distressed sales happened all year.
The swings in the seasonal factors were decreasing following the bust but have increased again recently - this time without a surge in distressed sales.
 The second graph shows the seasonal factors for the Case-Shiller National index since 1987. The factors started to change near the peak of the bubble, and really increased during the bust since normal sales followed the regular seasonal pattern - and distressed sales happened all year.
 The swings in the seasonal factors were decreasing following the bust but have increased again recently - this time without a surge in distressed sales.
Newsletter: New Home Sales Decrease to 623,000 Annual Rate in May
by Calculated Risk on 6/25/2025 10:51:00 AM
Today, in the Calculated Risk Real Estate Newsletter: New Home Sales Decrease to 623,000 Annual Rate in May
Brief excerpt:
The Census Bureau reported New Home Sales in May were at a seasonally adjusted annual rate (SAAR) of 623 thousand. The previous three months were revised down.There is much more in the article.
...
The next graph shows new home sales for 2024 and 2025 by month (Seasonally Adjusted Annual Rate). Sales in May 2025 were down 6.3% from May 2024.
New home sales, seasonally adjusted, have been down year-over-year in 4 of the last 5 months.

New Home Sales Decrease to 623,000 Annual Rate in May
by Calculated Risk on 6/25/2025 10:00:00 AM
The Census Bureau reports New Home Sales in May were at a seasonally adjusted annual rate (SAAR) of 623 thousand.
The previous three months were revised down.
Sales of new single-family houses in May 2025 were at a seasonally-adjusted annual rate of 623,000, according to estimates released jointly today by the U.S. Census Bureau and the Department of Housing and Urban Development. This is 13.7 percent below the April 2025 rate of 722,000, and is 6.3 percent below the May 2024 rate of 665,000.
emphasis added
 Click on graph for larger image.
The first graph shows New Home Sales vs. recessions since 1963. The dashed line is the current sales rate.
New home sales were below pre-pandemic levels.
The second graph shows New Home Months of Supply.
 The months of supply increased in May to 9.8 months from 8.3 months in April.
 The all-time record high was 12.2 months of supply in January 2009. The all-time record low was 3.3 months in August 2020.
This is well above the top of the normal range (about 4 to 6 months of supply is normal).
"The seasonally-adjusted estimate of new houses for sale at the end of May 2025 was 507,000. This is 1.4 percent above the April 2025 estimate of 500,000, and is 8.1 percent above the May 2024 estimate of 469,000.Sales were well below expectations of 710 thousand SAAR and sales for the three previous months were revised down. I'll have more later today.
This represents a supply of 9.8 months at the current sales rate. The months' supply is 18.1 percent above the April 2025 estimate of 8.3 months, and is 15.3 percent above the May 2024 estimate of 8.5 months. "
MBA: Mortgage Applications Increase in Latest MBA Weekly Survey
by Calculated Risk on 6/25/2025 07:00:00 AM
From the MBA: Mortgage Applications Increase in Latest MBA Weekly Survey
Mortgage applications increased 1.1 percent from one week earlier, according to data from the Mortgage Bankers Association’s (MBA) Weekly Mortgage Applications Survey for the week ending June 20, 2025. This week’s results include an adjustment for the Juneteenth holiday.
The Market Composite Index, a measure of mortgage loan application volume, increased 1.1 percent on a seasonally adjusted basis from one week earlier. On an unadjusted basis, the Index decreased 10 percent compared with the previous week. The Refinance Index increased 3 percent from the previous week and was 29 percent higher than the same week one year ago. The seasonally adjusted Purchase Index decreased 0.4 percent from one week earlier. The unadjusted Purchase Index decreased 11 percent compared with the previous week and was 12 percent higher than the same week one year ago.
“The combination of the ongoing conflict in the Middle East, current economic conditions, and last week’s FOMC meeting resulted in slightly lower Treasury rates on average. However, mortgage rates still edged higher but remained in the same narrow range, with the 30-year fixed rate increasing to 6.88 percent last week,” said Joel Kan, MBA’s Vice President and Deputy Chief Economist. “Applications increased slightly overall driven by FHA refinances, but conventional applications saw declines over the week. The average loan size for purchase applications declined to $436,300, the lowest level since January 2025, driven by decreasing conventional purchase loan sizes.”
...
The average contract interest rate for 30-year fixed-rate mortgages with conforming loan balances ($806,500 or less) increased to 6.88 percent from 6.84 percent, with points decreasing to 0.63 from 0.66 (including the origination fee) for 80 percent loan-to-value ratio (LTV) loans.
emphasis added
 Click on graph for larger image.
The first graph shows the MBA mortgage purchase index.
According to the MBA, purchase activity is up 12% year-over-year unadjusted.
Red is a four-week average (blue is weekly).
Purchase application activity is still depressed, but above the lows of October 2023 and is 9% above the lowest levels during the housing bust.

The second graph shows the refinance index since 1990.
The refinance index increased but remained very low.
Tuesday, June 24, 2025
Wednesday: New Home Sales, Fed Chair Powell Testimony
by Calculated Risk on 6/24/2025 07:45:00 PM
 Note: Mortgage rates are from MortgageNewsDaily.com and are for top tier scenarios.
Wednesday:
• At 7:00 AM ET, The Mortgage Bankers Association (MBA) will release the results for the mortgage purchase applications index.
• At 10:00 AM, New Home Sales for May from the Census Bureau. The consensus is for 710 thousand SAAR, down from 743 thousand in April.
• Also at 10:00 AM, Testimony, Fed Chair Jerome Powell, Semiannual Monetary Policy Report to Congress, Before the U.S. Senate Committee on Banking, Housing, and Urban Affairs
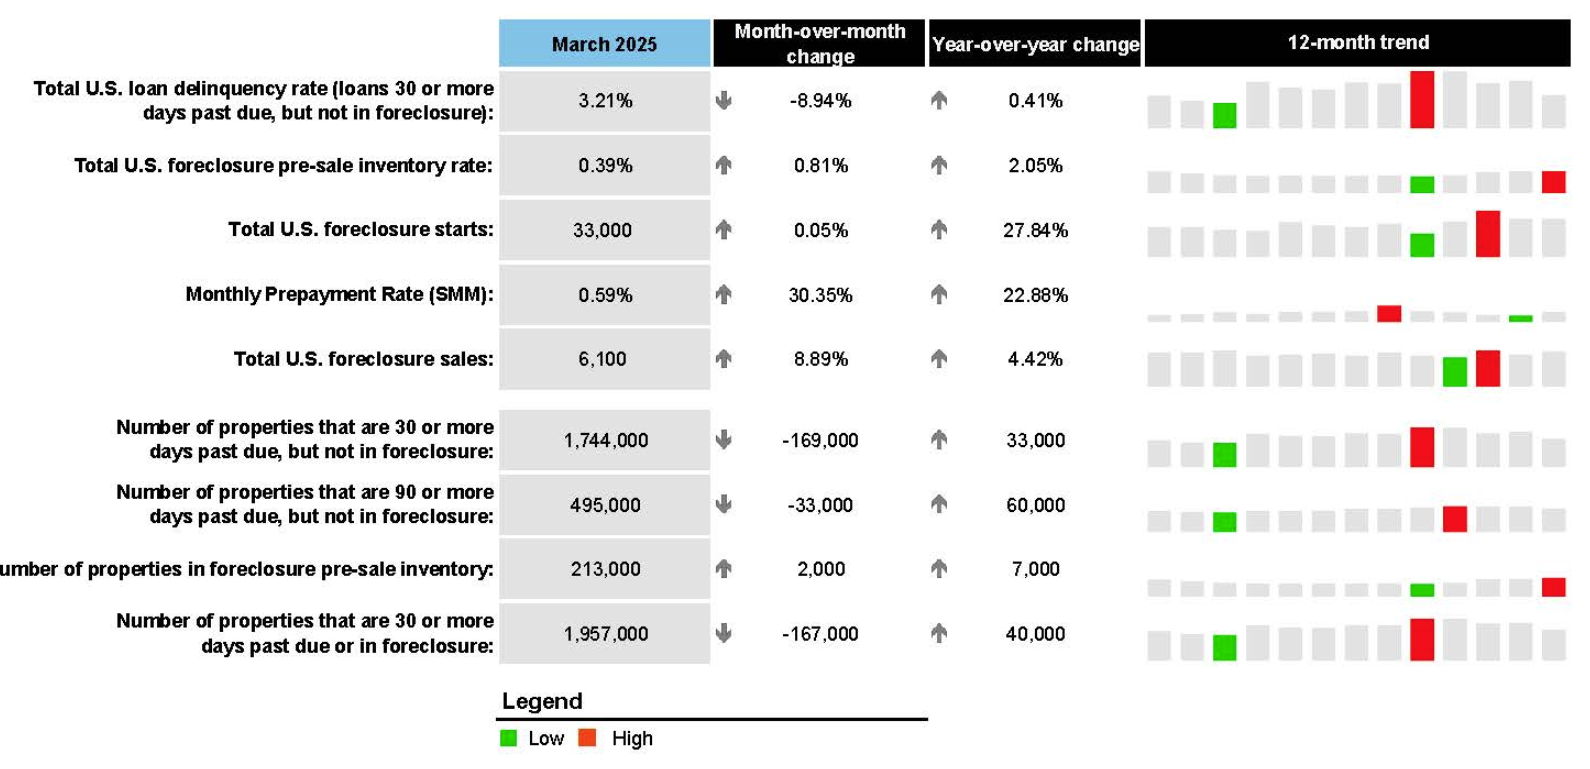
ICE First Look at May Mortgage Performance: "Delinquencies Hold Steady and Foreclosure Sales Rise to Highest Level Since Early 2023"
by Calculated Risk on 6/24/2025 04:06:00 PM
From Intercontinental Exchange: ICE First Look at Mortgage Performance: Delinquencies Hold Steady and Foreclosure Sales Rise to Highest Level Since Early 2023
Intercontinental Exchange, Inc. (NYSE:ICE) ... today released its May 2025 ICE First Look, which shows that delinquencies and foreclosure activity continues to trend slightly higher on an annual basis despite some seasonal and disaster recovery related improvement.
The ICE First Look reports on month-end delinquency, foreclosure and prepayment statistics sourced from its loan-level database, which covers a majority of the U.S. mortgage market. Key takeaways from this month’s findings include:
• The national delinquency rate ticked down 2 basis points (bps) to 3.20% in May, though it is up 5.2% (16 bps) year over year (YoY).
• Serious delinquencies – loans 90+ days past due but not in foreclosure – improved seasonally for the fifth consecutive month, but are still up 56K (14%) from the same time last year.
• Disaster-related delinquencies also improved, with those related to the 2024 hurricane season falling by nearly 5K (26%) month over month (MoM) and Los Angeles wildfire-related delinquencies falling by a more modest 9% MoM.
• Foreclosure starts and active foreclosure inventories climbed YoY, with May’s 7K foreclosure sales marking the largest single-month volume in more than two years.
• Prepayment activity, as measured by single month mortality, inched up to 0.71%, the highest level since October 2024, driven by a seasonal rise in home sale-related prepayments. Prepayments were up 23.4% YoY.
emphasis added
 Click on graph for larger image.
Here is a table from ICE.
Hotels: Occupancy Rate Decreased 2.4% Year-over-year
by Calculated Risk on 6/24/2025 01:16:00 PM
The U.S. hotel industry reported mostly negative year-over-year comparisons, according to CoStar’s latest data through 14 June. ...The following graph shows the seasonal pattern for the hotel occupancy rate using the four-week average.
8-14 June 2025 (percentage change from comparable week in 2024):
• Occupancy: 68.6% (-2.4%)
• Average daily rate (ADR): US$163.43 (+0.6%)
• Revenue per available room (RevPAR): US$112.11 (-1.8%)
emphasis added
 Click on graph for larger image.
The red line is for 2025, blue is the median, and dashed light blue is for 2024. Dashed purple is for 2018, the record year for hotel occupancy.
The 4-week average of the occupancy rate is tracking behind both last year and the median rate for the period 2000 through 2024 (Blue).
Note: Y-axis doesn't start at zero to better show the seasonal change.
The 4-week average will increase during the summer travel season; however, we will likely see a hit to occupancy during the summer months due to less international tourism.


