 RSS Feed
 by Calculated Risk on 5/30/2025 08:30:00 AM
Friday, May 30, 2025
Personal Income increased 0.8% in April; Spending increased 0.2%
From the BEA: Personal Income and Outlays, April 2025
Personal income increased $210.1 billion (0.8 percent at a monthly rate) in April, according to estimates released today by the U.S. Bureau of Economic Analysis. Disposable personal income (DPI)—personal income less personal current taxes—increased $189.4 billion (0.8 percent) and personal consumption expenditures (PCE) increased $47.8 billion (0.2 percent).The April PCE price index increased 2.1 percent year-over-year (YoY), down from 2.3 percent YoY in March, and down from the recent peak of 7.2 percent in June 2022.
Personal outlays—the sum of PCE, personal interest payments, and personal current transfer payments—increased $48.6 billion in April. Personal saving was $1.12 trillion in April and the personal saving rate—personal saving as a percentage of disposable personal income—was 4.9 percent.
From the preceding month, the PCE price index for April increased 0.1 percent. Excluding food and energy, the PCE price index also increased 0.1 percent.
From the same month one year ago, the PCE price index for April increased 2.1 percent. Excluding food and energy, the PCE price index increased 2.5 percent from one year ago.
emphasis added
The PCE price index, excluding food and energy, increased 2.5 percent YoY, down from 2.6 percent the previous month, and down from the recent peak of 5.6 percent in February 2022.
The following graph shows real Personal Consumption Expenditures (PCE) through April 2025 (2017 dollars). Note that the y-axis doesn't start at zero to better show the change.
 Click on graph for larger image.
The dashed red lines are the quarterly levels for real PCE.
Personal income was above expectations and PCE were at expectations.
Inflation was slightly below expectations.
Thursday, May 29, 2025
Friday: Personal Income and Outlays
by Calculated Risk on 5/29/2025 07:21:00 PM
 Note: Mortgage rates are from MortgageNewsDaily.com and are for top tier scenarios.
Friday:
• At 8:30 AM ET, Personal Income and Outlays, April 2025. The consensus is for a 0.3% increase in personal income, and for a 0.2% increase in personal spending. And for the Core PCE price index to increase 0.1%. PCE prices are expected to be up 2.2% YoY, and core PCE prices up 2.5% YoY.
• At 9:45 AM, Chicago Purchasing Managers Index for May.
• At 10:00 AM: University of Michigan's Consumer sentiment index (Final for May). The consensus is for a reading of 50.8.
Realtor.com Reports Most Actively "For Sale" Inventory since 2019
by Calculated Risk on 5/29/2025 01:08:00 PM
What this means: On a weekly basis, Realtor.com reports the year-over-year change in active inventory and new listings. On a monthly basis, they report total inventory. For May, Realtor.com reported inventory was up 30.6% YoY, but still down 16.3% compared to the 2017 to 2019 same month levels.
Now - on a weekly basis - inventory is up 29.7% YoY.
Realtor.com has monthly and weekly data on the existing home market. Here is their weekly report: Weekly Housing Trends View—Data for Week Ending May 24, 2025 Here is a graph of the year-over-year change in inventory according to realtor.com.
Inventory was up year-over-year for the 81st consecutive week.
Realtor.com has monthly and weekly data on the existing home market. Here is their weekly report: Weekly Housing Trends View—Data for Week Ending May 24, 2025
• Active inventory climbed 29.7% year-over-year
The number of homes actively for sale remains on a strong upward trajectory, now 29.7% higher than this time last year. This represents the 81st consecutive week of annual gains in inventory. There were more than 1 million homes for sale last week, the highest inventory level since December 2019.
• New listings—a measure of sellers putting homes up for sale—rising 8.2% year-over-year
New listings rose again last week, up 8.2% compared to the same period last year.
• The median list price was up 0.2% year-over-year
After a brief cooling period the previous week, the national median listing price resumed its upward trajectory last week. At the same time, the median listing price per square foot—which adjusts for changes in home size—rose 0.9% year-over-year.
 Here is a graph of the year-over-year change in inventory according to realtor.com.
 Inventory was up year-over-year for the 81st consecutive week.
New listings were solid.
Median list prices were mostly unchanged year-over-year.
NAR: Pending Home Sales Decrease 6.3% in April; Down 2.5% YoY
by Calculated Risk on 5/29/2025 10:00:00 AM
From the NAR: Pending Home Sales Declined 6.3% in April
Pending home sales decreased 6.3% in April, according to the National Association of REALTORS®. All four U.S. regions experienced month-over-month losses in transactions. Year-over-year, contract signings rose in the Midwest but descended in the Northeast, South and West – with the West suffering the greatest loss.Note: Contract signings usually lead sales by about 45 to 60 days, so this would usually be for closed sales in May and June.
The Pending Home Sales Index (PHSI)* – a forward-looking indicator of home sales based on contract signings – dove 6.3% to 71.3 in April. Year-over-year, pending transactions retracted by 2.5%. An index of 100 is equal to the level of contract activity in 2001.
"At this critical stage of the housing market, it is all about mortgage rates," said NAR Chief Economist Lawrence Yun. "Despite an increase in housing inventory, we are not seeing higher home sales. Lower mortgage rates are essential to bring home buyers back into the housing market."
...
The Northeast PHSI decreased 0.6% from last month to 62.1, down 3.0% from April 2024. The Midwest index condensed 5.0% to 73.5 in April, up 2.2% from the previous year.
The South PHSI sank 7.7% to 85.9 in April, down 3.0% from a year ago. The West index degraded 8.9% from the prior month to 53.3, down 6.5% from April 2024.
emphasis added
Q1 GDP Growth Revised up to -0.2% Annual Rate
by Calculated Risk on 5/29/2025 08:35:00 AM
From the BEA: Gross Domestic Product (Second Estimate), Corporate Profits (Preliminary Estimate), 1st Quarter 2025
Real gross domestic product (GDP) decreased at an annual rate of 0.2 percent in the first quarter of 2025 (January, February, and March), according to the second estimate released by the U.S. Bureau of Economic Analysis. In the fourth quarter of 2024, real GDP increased 2.4 percent.Here is a Comparison of Second and Advance Estimates. PCE growth was revised down from 1.8% to 1.2%. Residential investment was revised down from 1.3% to -0.6%.
The decrease in real GDP in the first quarter primarily reflected an increase in imports, which are a subtraction in the calculation of GDP, and a decrease in government spending. These movements were partly offset by increases in investment, consumer spending, and exports.
Real GDP was revised up 0.1 percentage point from the advance estimate, reflecting an upward revision to investment that was partly offset by a downward revision to consumer spending.
emphasis added
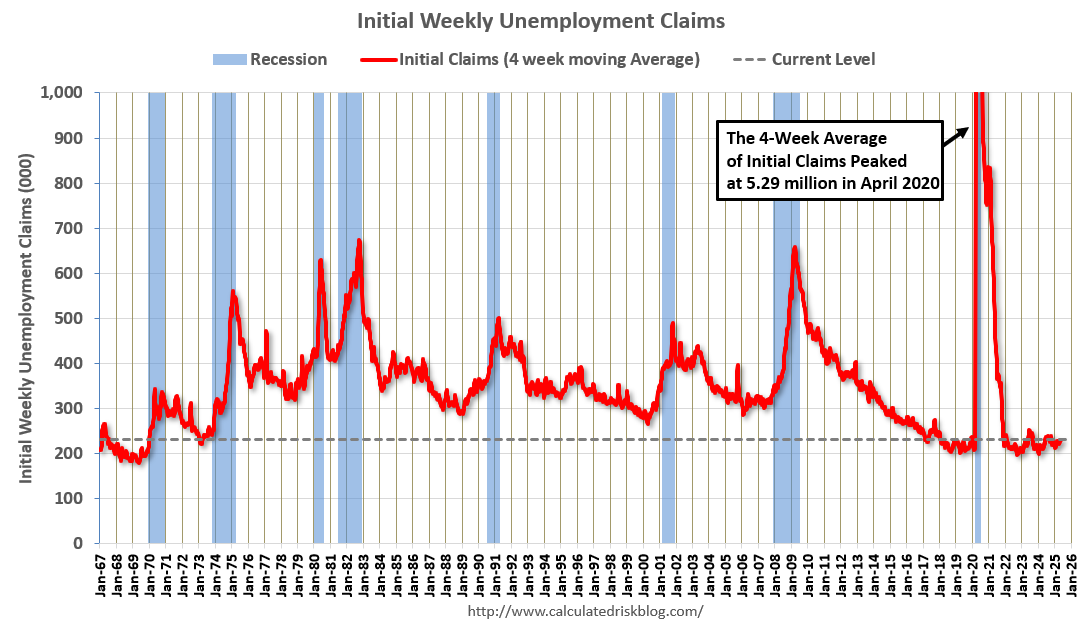
Weekly Initial Unemployment Claims Increase to 240,000
by Calculated Risk on 5/29/2025 08:30:00 AM
The DOL reported:
In the week ending May 24, the advance figure for seasonally adjusted initial claims was 240,000, an increase of 14,000 from the previous week's revised level. The previous week's level was revised down by 1,000 from 227,000 to 226,000. The 4-week moving average was 230,750, a decrease of 250 from the previous week's revised average. The previous week's average was revised down by 500 from 231,500 to 231,000.The following graph shows the 4-week moving average of weekly claims since 1971.
emphasis added
 Click on graph for larger image.
The dashed line on the graph is the current 4-week average. The four-week average of weekly unemployment claims decreased to 230,750.
The previous week was revised down.
Weekly claims were higher than the consensus forecast.
Wednesday, May 28, 2025
Thursday: GDP, Unemployment Claims, Pending Home Sales
by Calculated Risk on 5/28/2025 07:15:00 PM
 Note: Mortgage rates are from MortgageNewsDaily.com and are for top tier scenarios.
Thursday:
• At 8:30 AM, The initial weekly unemployment claims report will be released. The consensus is for initial claims of 225 thousand, down from 227 thousand last week.
• Also at 8:30 AM, Gross Domestic Product, 1st quarter 2025 (Second estimate). The consensus is that real GDP decreased 0.3% annualized in Q1, unchanged from the advance estimate of -0.3%.
• At 10:00 AM, Pending Home Sales Index for April. The consensus is for a 0.4% decrease in the index.
Las Vegas in April: Visitor Traffic Down 5.1% YoY; Convention Traffic up 13.9% YoY
by Calculated Risk on 5/28/2025 03:24:00 PM
From the Las Vegas Visitor Authority: April 2025 Las Vegas Visitor Statistics
With a strong convention segment and events including Wrestlemania, counterbalanced by consumer uncertainty with evolving federal policies, visitation saw a net YoY decrease of ‐5.1% as the destination hosted approximately 3.3 million visitors in April.
Convention attendance approached 574k attendees for the month, up 13.9% YoY, benefitting from the in‐rotation of shows that were held elsewhere last year including International Sign Expo (21k attendees), American Urological Association (15k attendees) and The Carwash Show (10k attendees).
Occupancy reached 84.5%, down ‐1.0 pt with Weekend occupancy of 93.8% (up +0.4 pts) and Midweek occupancy of 81.2% (down ‐1.4 pts). ADR for the month reached $190 (+4.4% YoY) with RevPAR of $161 (+3.2% YoY).
emphasis added
 Click on graph for larger image.
 The first graph shows visitor traffic for 2019 (Black), 2020 (dark blue), 2021 (light blue), 2022 (light orange), 2023 (orange), 2024 (dark orange) and 2025 (red).
Visitor traffic was down 5.1% compared to last April. Visitor traffic was down 5.8% compared to April 2019.
Year-to-date (YTD) visitor traffic is down 5.8% compared to the same period in 2019.
 Convention traffic was up 13.9% compared to April 2024, and up 8.3% compared to April 2019.
The second graph shows convention traffic.

YTD convention traffic is down 6.4% compared to 2019.
FOMC Minutes: "Difficult tradeoffs" if Inflation "more persistent" and "growth and employment weaken"
by Calculated Risk on 5/28/2025 03:07:00 PM
From the Fed: Minutes of the Federal Open Market Committee, May 6–7, 2025. Excerpt:
In considering the outlook for monetary policy, participants agreed that with economic growth and the labor market still solid and current monetary policy moderately restrictive, the Committee was well positioned to wait for more clarity on the outlooks for inflation and economic activity. Participants agreed that uncertainty about the economic outlook had increased further, making it appropriate to take a cautious approach until the net economic effects of the array of changes to government policies become clearer. Participants noted that monetary policy would be informed by a wide range of incoming data, the economic outlook, and the balance of risks.
In discussing risk-management considerations that could bear on the outlook for monetary policy, participants agreed that the risks of higher inflation and higher unemployment had risen. Almost all participants commented on the risk that inflation could prove to be more persistent than expected. Participants emphasized the importance of ensuring that longer-term inflation expectations remained well anchored, with some noting that expectations might be particularly sensitive because inflation had been above the Committee's target for an extended period. Participants noted that the Committee might face difficult tradeoffs if inflation proves to be more persistent while the outlooks for growth and employment weaken. Participants observed, however, that the ultimate extent of changes to government policy and their effects on the economy was highly uncertain. A few participants additionally noted that higher uncertainty could restrain business and consumer demand and that inflationary pressures could be damped if downside risks to economic activity or the labor market materialized.
emphasis added
Inflation Adjusted House Prices 1.0% Below 2022 Peak; Price-to-rent index is 8.1% below 2022 peak
by Calculated Risk on 5/28/2025 12:15:00 PM
Today, in the Calculated Risk Real Estate Newsletter: Inflation Adjusted House Prices 1.0% Below 2022 Peak
Excerpt:
It has been almost 19 years since the housing bubble peak, ancient history for some readers!There is much more in the article!
In the March Case-Shiller house price index released yesterday, the seasonally adjusted National Index (SA), was reported as being 78% above the bubble peak in 2006. However, in real terms, the National index (SA) is about 12% above the bubble peak (and historically there has been an upward slope to real house prices). The composite 20, in real terms, is 3% above the bubble peak.
People usually graph nominal house prices, but it is also important to look at prices in real terms. As an example, if a house price was $300,000 in January 2010, the price would be $441,000 today adjusted for inflation (47% increase). That is why the second graph below is important - this shows "real" prices.
The third graph shows the price-to-rent ratio, and the fourth graph is the affordability index. The last graph shows the 5-year real return based on the Case-Shiller National Index.
...
The second graph shows the same two indexes in real terms (adjusted for inflation using CPI).
In real terms (using CPI), the National index is 1.0% below the recent peak, and the Composite 20 index is 1.2% below the recent peak in 2022.
Both the real National index and the Comp-20 index decreased slightly in March.
It has now been 34 months since the real peak in house prices. Typically, after a sharp increase in prices, it takes a number of years for real prices to reach new highs (see House Prices: 7 Years in Purgatory)


