 RSS Feed
 by Calculated Risk on 5/29/2025 08:30:00 AM
Thursday, May 29, 2025
Weekly Initial Unemployment Claims Increase to 240,000
The DOL reported:
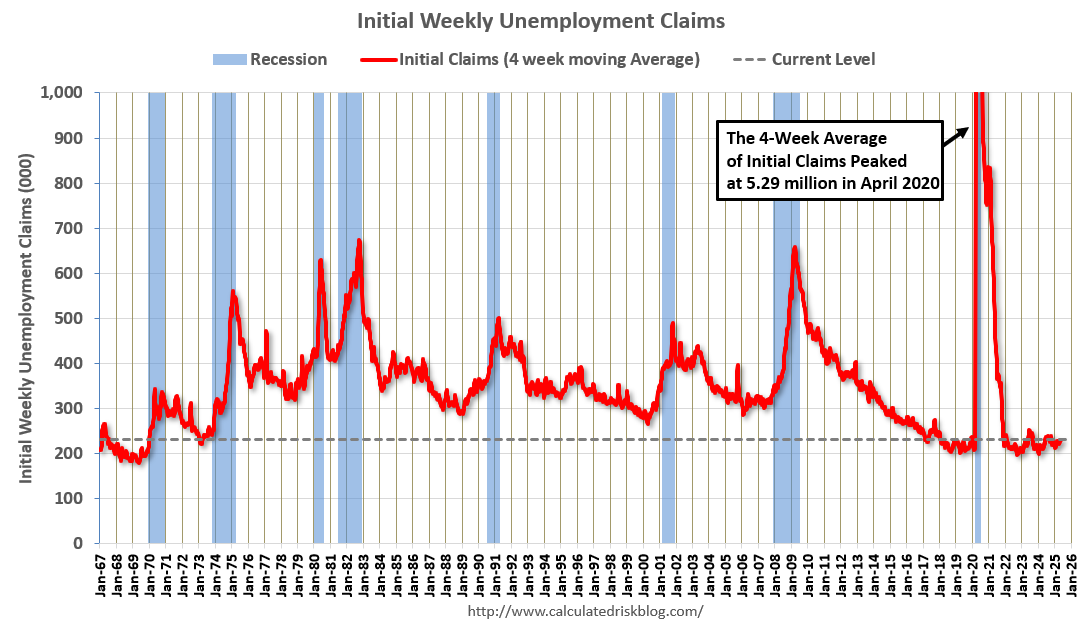
In the week ending May 24, the advance figure for seasonally adjusted initial claims was 240,000, an increase of 14,000 from the previous week's revised level. The previous week's level was revised down by 1,000 from 227,000 to 226,000. The 4-week moving average was 230,750, a decrease of 250 from the previous week's revised average. The previous week's average was revised down by 500 from 231,500 to 231,000.The following graph shows the 4-week moving average of weekly claims since 1971.
emphasis added
 Click on graph for larger image.
The dashed line on the graph is the current 4-week average. The four-week average of weekly unemployment claims decreased to 230,750.
The previous week was revised down.
Weekly claims were higher than the consensus forecast.
Wednesday, May 28, 2025
Thursday: GDP, Unemployment Claims, Pending Home Sales
by Calculated Risk on 5/28/2025 07:15:00 PM
 Note: Mortgage rates are from MortgageNewsDaily.com and are for top tier scenarios.
Thursday:
• At 8:30 AM, The initial weekly unemployment claims report will be released. The consensus is for initial claims of 225 thousand, down from 227 thousand last week.
• Also at 8:30 AM, Gross Domestic Product, 1st quarter 2025 (Second estimate). The consensus is that real GDP decreased 0.3% annualized in Q1, unchanged from the advance estimate of -0.3%.
• At 10:00 AM, Pending Home Sales Index for April. The consensus is for a 0.4% decrease in the index.
Las Vegas in April: Visitor Traffic Down 5.1% YoY; Convention Traffic up 13.9% YoY
by Calculated Risk on 5/28/2025 03:24:00 PM
From the Las Vegas Visitor Authority: April 2025 Las Vegas Visitor Statistics
With a strong convention segment and events including Wrestlemania, counterbalanced by consumer uncertainty with evolving federal policies, visitation saw a net YoY decrease of ‐5.1% as the destination hosted approximately 3.3 million visitors in April.
Convention attendance approached 574k attendees for the month, up 13.9% YoY, benefitting from the in‐rotation of shows that were held elsewhere last year including International Sign Expo (21k attendees), American Urological Association (15k attendees) and The Carwash Show (10k attendees).
Occupancy reached 84.5%, down ‐1.0 pt with Weekend occupancy of 93.8% (up +0.4 pts) and Midweek occupancy of 81.2% (down ‐1.4 pts). ADR for the month reached $190 (+4.4% YoY) with RevPAR of $161 (+3.2% YoY).
emphasis added
 Click on graph for larger image.
 The first graph shows visitor traffic for 2019 (Black), 2020 (dark blue), 2021 (light blue), 2022 (light orange), 2023 (orange), 2024 (dark orange) and 2025 (red).
Visitor traffic was down 5.1% compared to last April. Visitor traffic was down 5.8% compared to April 2019.
Year-to-date (YTD) visitor traffic is down 5.8% compared to the same period in 2019.
 Convention traffic was up 13.9% compared to April 2024, and up 8.3% compared to April 2019.
The second graph shows convention traffic.

YTD convention traffic is down 6.4% compared to 2019.
FOMC Minutes: "Difficult tradeoffs" if Inflation "more persistent" and "growth and employment weaken"
by Calculated Risk on 5/28/2025 03:07:00 PM
From the Fed: Minutes of the Federal Open Market Committee, May 6–7, 2025. Excerpt:
In considering the outlook for monetary policy, participants agreed that with economic growth and the labor market still solid and current monetary policy moderately restrictive, the Committee was well positioned to wait for more clarity on the outlooks for inflation and economic activity. Participants agreed that uncertainty about the economic outlook had increased further, making it appropriate to take a cautious approach until the net economic effects of the array of changes to government policies become clearer. Participants noted that monetary policy would be informed by a wide range of incoming data, the economic outlook, and the balance of risks.
In discussing risk-management considerations that could bear on the outlook for monetary policy, participants agreed that the risks of higher inflation and higher unemployment had risen. Almost all participants commented on the risk that inflation could prove to be more persistent than expected. Participants emphasized the importance of ensuring that longer-term inflation expectations remained well anchored, with some noting that expectations might be particularly sensitive because inflation had been above the Committee's target for an extended period. Participants noted that the Committee might face difficult tradeoffs if inflation proves to be more persistent while the outlooks for growth and employment weaken. Participants observed, however, that the ultimate extent of changes to government policy and their effects on the economy was highly uncertain. A few participants additionally noted that higher uncertainty could restrain business and consumer demand and that inflationary pressures could be damped if downside risks to economic activity or the labor market materialized.
emphasis added
Inflation Adjusted House Prices 1.0% Below 2022 Peak; Price-to-rent index is 8.1% below 2022 peak
by Calculated Risk on 5/28/2025 12:15:00 PM
Today, in the Calculated Risk Real Estate Newsletter: Inflation Adjusted House Prices 1.0% Below 2022 Peak
Excerpt:
It has been almost 19 years since the housing bubble peak, ancient history for some readers!There is much more in the article!
In the March Case-Shiller house price index released yesterday, the seasonally adjusted National Index (SA), was reported as being 78% above the bubble peak in 2006. However, in real terms, the National index (SA) is about 12% above the bubble peak (and historically there has been an upward slope to real house prices). The composite 20, in real terms, is 3% above the bubble peak.
People usually graph nominal house prices, but it is also important to look at prices in real terms. As an example, if a house price was $300,000 in January 2010, the price would be $441,000 today adjusted for inflation (47% increase). That is why the second graph below is important - this shows "real" prices.
The third graph shows the price-to-rent ratio, and the fourth graph is the affordability index. The last graph shows the 5-year real return based on the Case-Shiller National Index.
...
The second graph shows the same two indexes in real terms (adjusted for inflation using CPI).
In real terms (using CPI), the National index is 1.0% below the recent peak, and the Composite 20 index is 1.2% below the recent peak in 2022.
Both the real National index and the Comp-20 index decreased slightly in March.
It has now been 34 months since the real peak in house prices. Typically, after a sharp increase in prices, it takes a number of years for real prices to reach new highs (see House Prices: 7 Years in Purgatory)

FDIC: Commercial Real Estate "Past-Due and nonaccrual" Highest Since 2014
by Calculated Risk on 5/28/2025 10:00:00 AM
The FDIC released the Quarterly Banking Profile for Q1 2025:
Net Income Increased from the Prior Quarter, Led by Higher Noninterest Income
Quarterly net income for the 4,462 FDIC-insured commercial banks and savings institutions totaled $70.6 billion, up $3.8 billion (5.8 percent) from the prior quarter. The banking industry reported an aggregate return on assets of 1.16 percent in first quarter 2025, up from 1.11 percent in fourth quarter 2024 and up from 1.09 percent in the year-ago quarter. The quarterly increase in net income was led by higher noninterest income (up $5.4 billion, or 7 percent). Gains in noninterest income were due to market movements and volatility as several large firms reported mark-to-market gains on certain financial instruments in the quarter. Industry noninterest income also benefited from other one-time items, such as gains on loan sales. Lower losses on the sale of securities also contributed to the increase in net income.
...
Asset Quality Metrics Remained Generally Favorable, Though Weakness in Certain Portfolios Persisted
Past-due and nonaccrual (PDNA) loans, or loans that are 30 or more days past due or in nonaccrual status, fell 1 basis point from the prior quarter to 1.59 percent of total loans. The industry’s PDNA ratio is still below the pre-pandemic average of 1.94 percent. While banks reported quarterly decreases in PDNA credit card loans (down $2.7 billion, or 9 basis points to 3.22 percent) and auto loans (down $2.6 billion, or 48 basis points to 2.84 percent), weaknesses persisted in certain portfolios. The PDNA rate for commercial real estate (CRE) loan portfolios is the highest it has been since fourth quarter 2014 at 1.49 percent. Multifamily CRE PDNAs have grown the most in the past year, up 88 basis points to 1.47 percent.
The industry’s net charge-off rate decreased 3 basis points to 0.67 percent from the prior quarter and is 1 basis point higher than the year-ago quarter and 19 basis points above the pre-pandemic average. Most portfolios have net charge-off rates above their pre-pandemic averages including credit card loans, which are 123 basis points above the pre-pandemic average at 4.71 percent.
emphasis added
 Click on graph for larger image.
From the FDIC:
The Number of Problem Banks Decreased in the First QuarterThis graph from the FDIC shows the number of problem banks.
The number of banks on the FDIC’s “Problem Bank List” decreased by a net of three in the first quarter to 63 banks. The number of problem banks represented 1.4 percent of total banks in the first quarter, which is in the middle of the normal range for non-crisis periods of 1 to 2 percent of all banks.
MBA: Mortgage Applications Decrease in Latest MBA Weekly Survey
by Calculated Risk on 5/28/2025 07:00:00 AM
From the MBA: Mortgage Applications Decrease in Latest MBA Weekly Survey
Mortgage applications decreased 1.2 percent from one week earlier, according to data from the Mortgage Bankers Association’s (MBA) Weekly Mortgage Applications Survey for the week ending May 23, 2025.
The Market Composite Index, a measure of mortgage loan application volume, decreased 1.2 percent on a seasonally adjusted basis from one week earlier. On an unadjusted basis, the Index decreased 2 percent compared with the previous week. The Refinance Index decreased 7 percent from the previous week and was 37 percent higher than the same week one year ago. The seasonally adjusted Purchase Index increased 3 percent from one week earlier. The unadjusted Purchase Index increased 2 percent compared with the previous week and was 18 percent higher than the same week one year ago.
“Mortgage rates reached its highest level since January, following higher Treasury yields. Additional market volatility has added to the increase, keeping the mortgage-Treasury spread wider than it was earlier this year. The 30-year fixed rate increased to 6.98 percent, its third consecutive weekly increase,” said Joel Kan, MBA’s Vice President and Deputy Chief Economist. “As a result of these higher rates, applications activity decreased, driven by a 7 percent decline in refinance applications. Conventional refinances were down 6 percent, and VA refinances dropped 16 percent. Purchase applications were up over the week and continue to run ahead of last year's pace as increased housing inventory in many markets has been supporting some transaction volume, despite the economic uncertainty.”
...
The average contract interest rate for 30-year fixed-rate mortgages with conforming loan balances ($806,500 or less) increased to 6.98 percent from 6.92 percent, with points decreasing to 0.67 from 0.69 (including the origination fee) for 80 percent loan-to-value ratio (LTV) loans.
emphasis added
 Click on graph for larger image.
The first graph shows the MBA mortgage purchase index.
According to the MBA, purchase activity is up 18% year-over-year unadjusted.
Red is a four-week average (blue is weekly).
Purchase application activity is still depressed, but above the lows of October 2023 and is 7% above the lowest levels during the housing bust.

The second graph shows the refinance index since 1990.
The refinance index decreased and remained very low.
Tuesday, May 27, 2025
Wednesday: FOMC Minutes
by Calculated Risk on 5/27/2025 07:17:00 PM
 Note: Mortgage rates are from MortgageNewsDaily.com and are for top tier scenarios.
Wednesday:
• At 7:00 AM ET, The Mortgage Bankers Association (MBA) will release the results for the mortgage purchase applications index.
• At 10:00 AM, Richmond Fed Survey of Manufacturing Activity for May.
2:00 PM, FOMC Minutes, Minutes Meeting of May 6-7, 2025
A few comments on the Seasonal Pattern for House Prices
by Calculated Risk on 5/27/2025 01:10:00 PM
Another update ... a few key points:
1) There is a clear seasonal pattern for house prices.
2) The surge in distressed sales during the housing bust distorted the seasonal pattern. This was because distressed sales (at lower price points) happened at a steady rate all year, while regular sales followed the normal seasonal pattern. This made for larger swings in the seasonal factor during the housing bust.
3) The seasonal swings have increased recently without a surge in distressed sales.
 Click on graph for larger image.
This graph shows the month-to-month change in the NSA Case-Shiller National index since 1987 (through March 2025). The seasonal pattern was smaller back in the '90s and early '00s and increased once the bubble burst.
The seasonal swings declined following the bust, however the pandemic price surge changed the month-over-month pattern.
 The second graph shows the seasonal factors for the Case-Shiller National index since 1987. The factors started to change near the peak of the bubble, and really increased during the bust since normal sales followed the regular seasonal pattern - and distressed sales happened all year.
The swings in the seasonal factors were decreasing following the bust but have increased again recently - this time without a surge in distressed sales.
 Click on graph for larger image.
This graph shows the month-to-month change in the NSA Case-Shiller National index since 1987 (through March 2025). The seasonal pattern was smaller back in the '90s and early '00s and increased once the bubble burst.
The seasonal swings declined following the bust, however the pandemic price surge changed the month-over-month pattern.
 The second graph shows the seasonal factors for the Case-Shiller National index since 1987. The factors started to change near the peak of the bubble, and really increased during the bust since normal sales followed the regular seasonal pattern - and distressed sales happened all year.
 The swings in the seasonal factors were decreasing following the bust but have increased again recently - this time without a surge in distressed sales.
Newsletter: Case-Shiller: National House Price Index Up 3.4% year-over-year in March
by Calculated Risk on 5/27/2025 09:52:00 AM
Today, in the Calculated Risk Real Estate Newsletter: Case-Shiller: National House Price Index Up 3.4% year-over-year in March
Excerpt:
S&P/Case-Shiller released the monthly Home Price Indices for March ("March" is a 3-month average of January, February and March closing prices). January closing prices include some contracts signed in November, so there is a significant lag to this data. Here is a graph of the month-over-month (MoM) change in the Case-Shiller National Index Seasonally Adjusted (SA).
The MoM decrease in the seasonally adjusted (SA) Case-Shiller National Index was at -0.30% (a -3.5% annual rate), This was the first MoM decrease since January 2023.
On a seasonally adjusted basis, prices increased month-to-month in just 6 of the 20 Case-Shiller cities. San Francisco has fallen 6.3% from the recent peak, Tampa is down 2.6% from the peak, and Denver down 1.9%.


